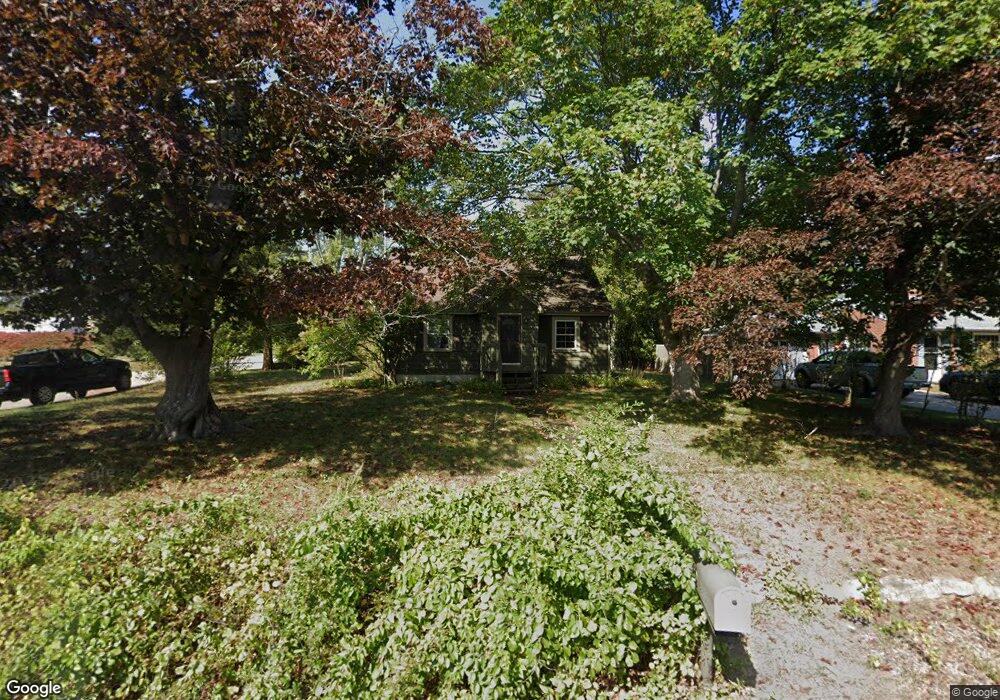
36 Babcock Rd Westerly, RI 02891
Estimated Value: $449,836 - $640,000
3
Beds
2
Baths
1,247
Sq Ft
$416/Sq Ft
Est. Value
About This Home
This home is located at 36 Babcock Rd, Westerly, RI 02891 and is currently estimated at $518,209, approximately $415 per square foot. 36 Babcock Rd is a home located in Washington County with nearby schools including Westerly High School and St. Michael School.
Ownership History
Date
Name
Owned For
Owner Type
Purchase Details
Closed on
Feb 26, 2016
Sold by
Crawford Kelly A
Bought by
Crawford Stephen L
Current Estimated Value
Purchase Details
Closed on
Mar 29, 1996
Sold by
Signor Nancy W
Bought by
Crawford Stephen L and Crawford Kelly
Create a Home Valuation Report for This Property
The Home Valuation Report is an in-depth analysis detailing your home's value as well as a comparison with similar homes in the area
Home Values in the Area
Average Home Value in this Area
Purchase History
| Date | Buyer | Sale Price | Title Company |
|---|---|---|---|
| Crawford Stephen L | -- | -- | |
| Crawford Stephen L | $104,000 | -- |
Source: Public Records
Mortgage History
| Date | Status | Borrower | Loan Amount |
|---|---|---|---|
| Previous Owner | Crawford Stephen L | $40,000 | |
| Previous Owner | Crawford Stephen L | $165,000 | |
| Previous Owner | Crawford Stephen L | $39,000 | |
| Previous Owner | Crawford Stephen L | $15,000 |
Source: Public Records
Tax History Compared to Growth
Tax History
| Year | Tax Paid | Tax Assessment Tax Assessment Total Assessment is a certain percentage of the fair market value that is determined by local assessors to be the total taxable value of land and additions on the property. | Land | Improvement |
|---|---|---|---|---|
| 2025 | $2,566 | $329,800 | $166,800 | $163,000 |
| 2024 | $2,795 | $267,500 | $119,100 | $148,400 |
| 2023 | $2,718 | $267,500 | $119,100 | $148,400 |
| 2022 | $2,702 | $267,500 | $119,100 | $148,400 |
| 2021 | $2,639 | $218,800 | $103,600 | $115,200 |
| 2020 | $2,593 | $218,800 | $103,600 | $115,200 |
| 2019 | $2,569 | $218,800 | $103,600 | $115,200 |
| 2018 | $2,443 | $197,800 | $103,600 | $94,200 |
| 2017 | $2,374 | $197,800 | $103,600 | $94,200 |
| 2016 | $2,374 | $197,800 | $103,600 | $94,200 |
| 2015 | $2,329 | $207,400 | $110,800 | $96,600 |
| 2014 | $2,292 | $207,400 | $110,800 | $96,600 |
Source: Public Records
Map
Nearby Homes
- 9 Cedar Crest Dr
- 2 Brass Ring Rd
- 18 Timothy Dr
- 5 Jana Rd
- 11 Hubbard St
- 3 Riverview Ave
- 28 Whipple Ave
- 7 Spring Pond Rd
- 24 Abbey Ln Unit 13
- 23 Abbey Ln Unit 12
- 18 No Bottom Ridge Ridge
- 6 Newbury Dr
- 13 No Bottom Ridge Rd
- 23 Summertime Cir
- 22 Summertime Cir
- 9 Compass Way Unit 201
- 9 Compass Way Unit 202
- 9 Compass Way Unit 101
- 9 Compass Way Unit 102
- 9 Compass Way Unit 103