36 Bishop Rd Lawrenceburg, TN 38464
Estimated Value: $289,000 - $398,000
--
Bed
2
Baths
3,522
Sq Ft
$98/Sq Ft
Est. Value
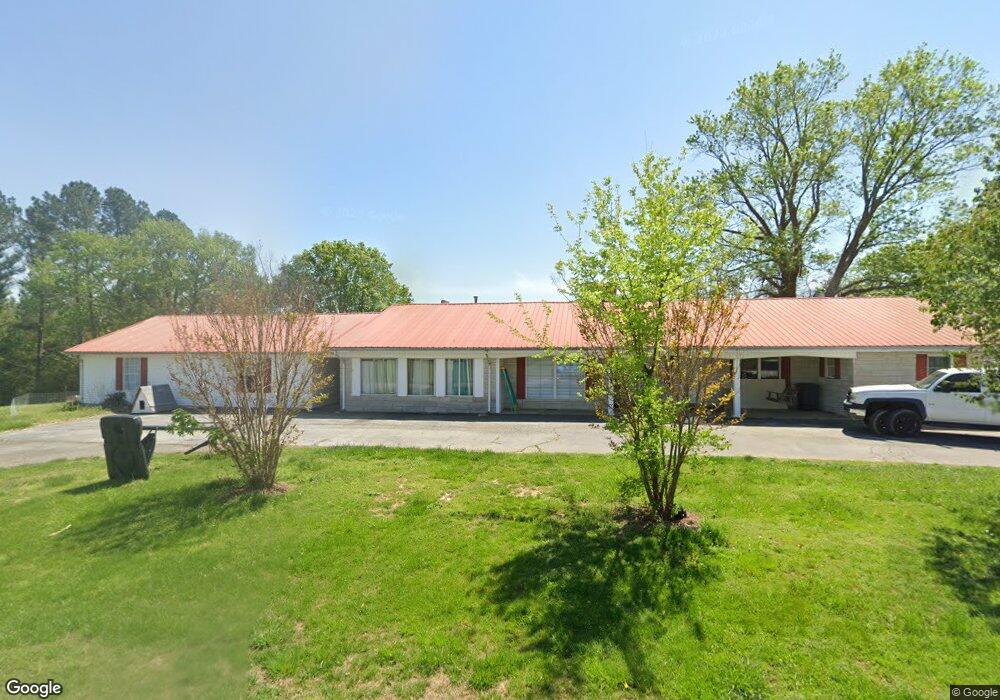
About This Home
This home is located at 36 Bishop Rd, Lawrenceburg, TN 38464 and is currently estimated at $344,261, approximately $97 per square foot. 36 Bishop Rd is a home located in Lawrence County with nearby schools including Ingram Sowell Elementary School, Lawrenceburg Public Elementary School, and David Crockett Elementary School.
Ownership History
Date
Name
Owned For
Owner Type
Purchase Details
Closed on
Sep 1, 2021
Sold by
Franklin Neva
Bought by
Wininger Lee Christopher and Wininger Ashley Nicole
Current Estimated Value
Home Financials for this Owner
Home Financials are based on the most recent Mortgage that was taken out on this home.
Original Mortgage
$230,743
Outstanding Balance
$209,181
Interest Rate
2.7%
Mortgage Type
FHA
Estimated Equity
$135,080
Purchase Details
Closed on
Jun 26, 2009
Sold by
Franklin Neva
Bought by
Olive Sherry
Purchase Details
Closed on
Mar 12, 2007
Sold by
Ronald Franklin
Bought by
James Olive
Purchase Details
Closed on
Nov 23, 2005
Sold by
Neva Franklin
Bought by
Ronald Franklin
Purchase Details
Closed on
Nov 14, 2005
Bought by
Franklin Anthony and Franklin Sherry Olive
Purchase Details
Closed on
Jun 16, 1975
Bought by
Franklin Buell T and Franklin Neva
Purchase Details
Closed on
Jan 9, 1965
Bought by
Appleton Noel Gilbert
Create a Home Valuation Report for This Property
The Home Valuation Report is an in-depth analysis detailing your home's value as well as a comparison with similar homes in the area
Home Values in the Area
Average Home Value in this Area
Purchase History
| Date | Buyer | Sale Price | Title Company |
|---|---|---|---|
| Wininger Lee Christopher | $235,000 | None Available | |
| Olive Sherry | -- | -- | |
| James Olive | $35,000 | -- | |
| Ronald Franklin | $13,353 | -- | |
| Franklin Anthony | $43,000 | -- | |
| Franklin Buell T | -- | -- | |
| Appleton Noel Gilbert | -- | -- |
Source: Public Records
Mortgage History
| Date | Status | Borrower | Loan Amount |
|---|---|---|---|
| Open | Wininger Lee Christopher | $230,743 |
Source: Public Records
Tax History Compared to Growth
Tax History
| Year | Tax Paid | Tax Assessment Tax Assessment Total Assessment is a certain percentage of the fair market value that is determined by local assessors to be the total taxable value of land and additions on the property. | Land | Improvement |
|---|---|---|---|---|
| 2025 | $1,264 | $62,875 | $0 | $0 |
| 2024 | $1,264 | $62,875 | $9,075 | $53,800 |
| 2023 | $1,264 | $62,875 | $9,075 | $53,800 |
| 2022 | $1,729 | $86,000 | $9,075 | $76,925 |
| 2021 | $1,113 | $37,625 | $5,825 | $31,800 |
| 2020 | $1,113 | $37,625 | $5,825 | $31,800 |
| 2019 | $1,113 | $37,625 | $5,825 | $31,800 |
| 2018 | $1,113 | $37,625 | $5,825 | $31,800 |
| 2017 | $1,113 | $37,625 | $5,825 | $31,800 |
| 2016 | $1,113 | $37,625 | $5,825 | $31,800 |
| 2015 | $1,030 | $37,625 | $5,825 | $31,800 |
| 2014 | $993 | $36,275 | $5,825 | $30,450 |
Source: Public Records
Map
Nearby Homes