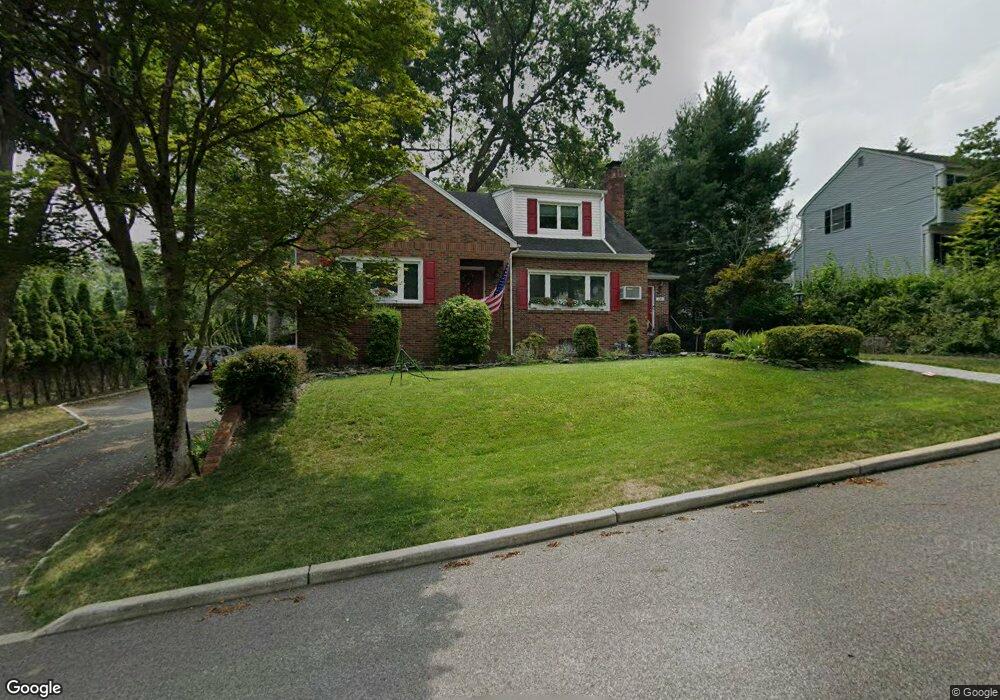
36 Boat St North Haledon, NJ 07508
Estimated Value: $666,288 - $853,000
--
Bed
--
Bath
2,555
Sq Ft
$307/Sq Ft
Est. Value
About This Home
This home is located at 36 Boat St, North Haledon, NJ 07508 and is currently estimated at $783,572, approximately $306 per square foot. 36 Boat St is a home located in Passaic County with nearby schools including Memorial Elementary School, High Mountain Middle School, and Manchester Reg High School.
Ownership History
Date
Name
Owned For
Owner Type
Purchase Details
Closed on
Jun 19, 2014
Sold by
Percarpio Margaret R
Bought by
Jones Bradley and Jones Mary Ann
Current Estimated Value
Home Financials for this Owner
Home Financials are based on the most recent Mortgage that was taken out on this home.
Original Mortgage
$250,000
Outstanding Balance
$135,185
Interest Rate
4.19%
Mortgage Type
Purchase Money Mortgage
Estimated Equity
$648,387
Create a Home Valuation Report for This Property
The Home Valuation Report is an in-depth analysis detailing your home's value as well as a comparison with similar homes in the area
Home Values in the Area
Average Home Value in this Area
Purchase History
| Date | Buyer | Sale Price | Title Company |
|---|---|---|---|
| Jones Bradley | $375,000 | None Available |
Source: Public Records
Mortgage History
| Date | Status | Borrower | Loan Amount |
|---|---|---|---|
| Open | Jones Bradley | $250,000 |
Source: Public Records
Tax History Compared to Growth
Tax History
| Year | Tax Paid | Tax Assessment Tax Assessment Total Assessment is a certain percentage of the fair market value that is determined by local assessors to be the total taxable value of land and additions on the property. | Land | Improvement |
|---|---|---|---|---|
| 2025 | $11,861 | $387,600 | $129,800 | $257,800 |
| 2024 | $11,469 | $387,600 | $129,800 | $257,800 |
| 2022 | $11,376 | $387,600 | $129,800 | $257,800 |
| 2021 | $11,260 | $387,600 | $129,800 | $257,800 |
| 2020 | $11,194 | $387,600 | $129,800 | $257,800 |
| 2019 | $11,101 | $387,600 | $129,800 | $257,800 |
| 2018 | $10,989 | $383,700 | $129,800 | $253,900 |
| 2017 | $10,935 | $383,700 | $129,800 | $253,900 |
| 2016 | $10,493 | $373,800 | $129,800 | $244,000 |
| 2015 | $10,392 | $373,800 | $129,800 | $244,000 |
| 2014 | $10,179 | $373,800 | $129,800 | $244,000 |
Source: Public Records
Map
Nearby Homes