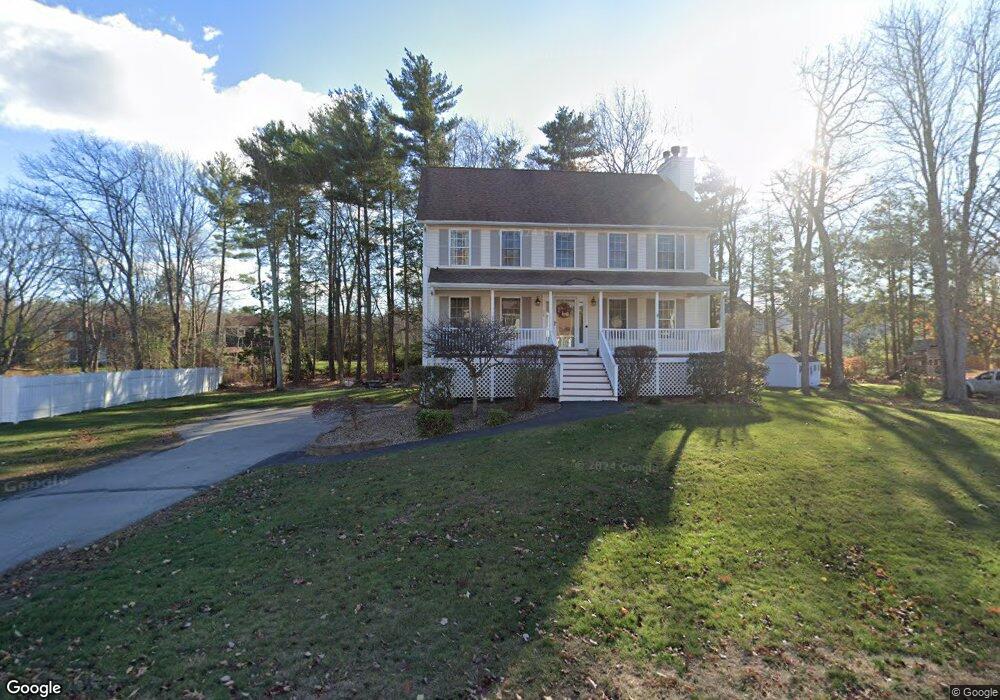
36 Border Winds Ave Seabrook, NH 03874
Estimated Value: $637,796 - $741,000
3
Beds
3
Baths
1,872
Sq Ft
$369/Sq Ft
Est. Value
About This Home
This home is located at 36 Border Winds Ave, Seabrook, NH 03874 and is currently estimated at $690,199, approximately $368 per square foot. 36 Border Winds Ave is a home located in Rockingham County with nearby schools including Seabrook Elementary School, Seabrook Middle School, and Winnacunnet High School.
Ownership History
Date
Name
Owned For
Owner Type
Purchase Details
Closed on
Dec 16, 2024
Sold by
Wise Paul A and Wise Diane
Bought by
Wise Ft and Wise
Current Estimated Value
Purchase Details
Closed on
Apr 29, 2011
Sold by
Battle Bernard J and Battle Alison C
Bought by
Macdonald Michael and Macdonald Kim
Home Financials for this Owner
Home Financials are based on the most recent Mortgage that was taken out on this home.
Original Mortgage
$150,000
Interest Rate
4.76%
Mortgage Type
Purchase Money Mortgage
Purchase Details
Closed on
Aug 6, 2004
Sold by
Brennan John T and Brennan Mary E
Bought by
Battle Bernard J and Battle Alison C
Purchase Details
Closed on
May 10, 2002
Sold by
Franciosa Deanne and Franciosa Anthony W
Bought by
Brennan John T and Brennan Mary E
Create a Home Valuation Report for This Property
The Home Valuation Report is an in-depth analysis detailing your home's value as well as a comparison with similar homes in the area
Home Values in the Area
Average Home Value in this Area
Purchase History
| Date | Buyer | Sale Price | Title Company |
|---|---|---|---|
| Wise Ft | -- | None Available | |
| Wise Ft | -- | None Available | |
| Macdonald Michael | $315,000 | -- | |
| Battle Bernard J | $377,500 | -- | |
| Brennan John T | $299,900 | -- | |
| Macdonald Michael | $315,000 | -- | |
| Battle Bernard J | $377,500 | -- | |
| Brennan John T | $299,900 | -- |
Source: Public Records
Mortgage History
| Date | Status | Borrower | Loan Amount |
|---|---|---|---|
| Previous Owner | Brennan John T | $20,000 | |
| Previous Owner | Brennan John T | $150,000 |
Source: Public Records
Tax History
| Year | Tax Paid | Tax Assessment Tax Assessment Total Assessment is a certain percentage of the fair market value that is determined by local assessors to be the total taxable value of land and additions on the property. | Land | Improvement |
|---|---|---|---|---|
| 2024 | $6,807 | $580,800 | $274,800 | $306,000 |
| 2023 | $7,053 | $467,400 | $228,900 | $238,500 |
| 2022 | $6,193 | $467,400 | $228,900 | $238,500 |
| 2021 | $6,417 | $467,400 | $228,900 | $238,500 |
| 2020 | $5,874 | $367,800 | $174,200 | $193,600 |
| 2019 | $5,793 | $367,800 | $174,200 | $193,600 |
| 2018 | $5,977 | $367,800 | $174,200 | $193,600 |
| 2017 | $5,504 | $338,700 | $145,100 | $193,600 |
| 2016 | $5,009 | $338,700 | $145,100 | $193,600 |
| 2015 | $4,631 | $313,100 | $136,200 | $176,900 |
| 2014 | $4,781 | $313,100 | $136,200 | $176,900 |
| 2013 | $4,781 | $313,100 | $136,200 | $176,900 |
Source: Public Records
Map
Nearby Homes
- 24 Adder Ln
- 51 Locust St
- 35 New Zealand Rd
- 127 Kensington Rd
- 253 Amesbury Rd
- 6 Forest Dr
- 269 South Rd
- 188 Kensington Rd
- 241 & 245 Lafayette Rd
- 195 Amesbury Rd
- 82 Monroe St
- 149 Market St
- 188 Lafayette Rd
- 5 Russell St Unit 1
- 25 Whittier Meadows Dr
- 151 Walton Rd
- 7 Toll Rd
- 21 Congress St
- 35 Huntington Ave
- 25 Bayberry Ln
- 32 Border Winds Ave
- 40 Border Winds Ave
- 59 Ledge Rd Unit B
- 59 Ledge Rd Unit A
- 59 Ledge Rd Unit 3
- 59 Ledge Rd Unit 59-4
- 37 Border Winds Ave
- 63 Ledge Rd
- 33 Border Winds Ave
- 28 Border Winds Ave
- 57 Ledge Rd Unit B
- 57 Ledge Rd Unit A
- 57 Ledge Rd Unit 57A
- 57 Ledge Rd
- 41 Border Winds Ave
- 29 Border Winds Ave
- 63 Border Winds Ave
- 44 Border Winds Ave
- 61 Ledge Rd
- 24 Border Winds Ave
Your Personal Tour Guide
Ask me questions while you tour the home.