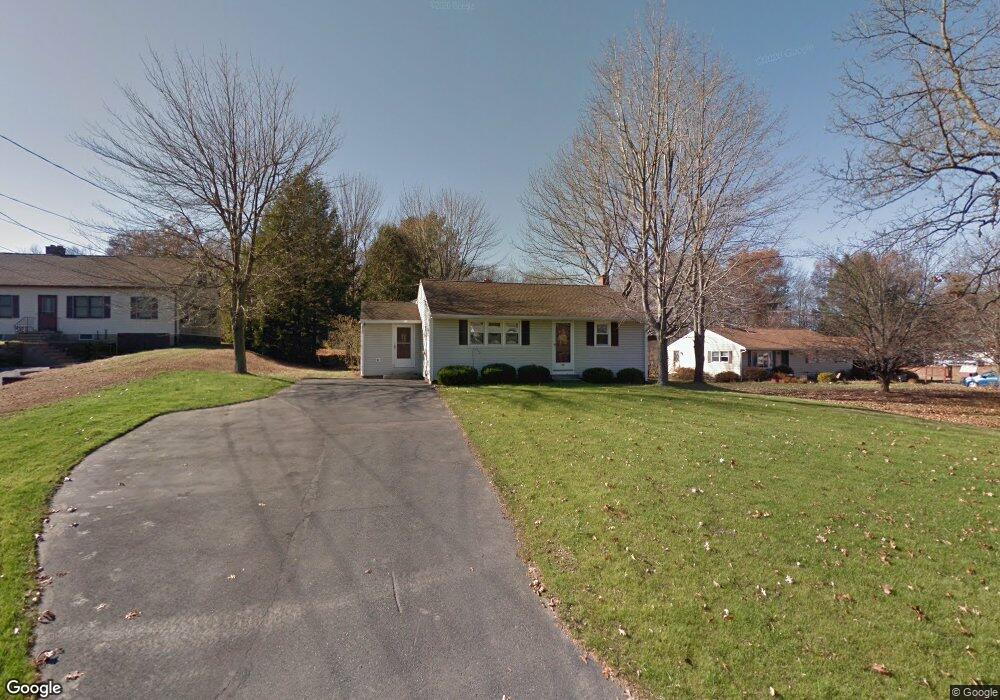
36 Brook St Easthampton, MA 01027
Estimated Value: $362,000 - $417,000
2
Beds
2
Baths
1,094
Sq Ft
$355/Sq Ft
Est. Value
About This Home
This home is located at 36 Brook St, Easthampton, MA 01027 and is currently estimated at $388,042, approximately $354 per square foot. 36 Brook St is a home located in Hampshire County with nearby schools including Easthampton High School, Tri-County Schools, and New England Adolescent Research Institute.
Ownership History
Date
Name
Owned For
Owner Type
Purchase Details
Closed on
Feb 26, 2023
Sold by
Laliberte Richard A and Laliberte Christine R
Bought by
Laliberte Rchard A
Current Estimated Value
Purchase Details
Closed on
Feb 20, 2023
Sold by
Laliberte Richard A
Bought by
Richard A Laliberte Ret
Create a Home Valuation Report for This Property
The Home Valuation Report is an in-depth analysis detailing your home's value as well as a comparison with similar homes in the area
Home Values in the Area
Average Home Value in this Area
Purchase History
| Date | Buyer | Sale Price | Title Company |
|---|---|---|---|
| Laliberte Rchard A | -- | None Available | |
| Richard A Laliberte Ret | -- | None Available |
Source: Public Records
Tax History
| Year | Tax Paid | Tax Assessment Tax Assessment Total Assessment is a certain percentage of the fair market value that is determined by local assessors to be the total taxable value of land and additions on the property. | Land | Improvement |
|---|---|---|---|---|
| 2025 | $4,830 | $353,300 | $133,600 | $219,700 |
| 2024 | $4,662 | $343,800 | $129,700 | $214,100 |
| 2023 | $3,566 | $243,400 | $102,800 | $140,600 |
| 2022 | $4,023 | $243,400 | $102,800 | $140,600 |
| 2021 | $4,392 | $250,400 | $102,800 | $147,600 |
| 2020 | $4,323 | $243,400 | $102,800 | $140,600 |
| 2019 | $3,632 | $234,900 | $102,800 | $132,100 |
| 2018 | $3,482 | $217,600 | $96,800 | $120,800 |
| 2017 | $3,398 | $209,600 | $93,000 | $116,600 |
| 2016 | $3,268 | $209,600 | $93,000 | $116,600 |
| 2015 | $3,175 | $209,600 | $93,000 | $116,600 |
Source: Public Records
Map
Nearby Homes
Your Personal Tour Guide
Ask me questions while you tour the home.