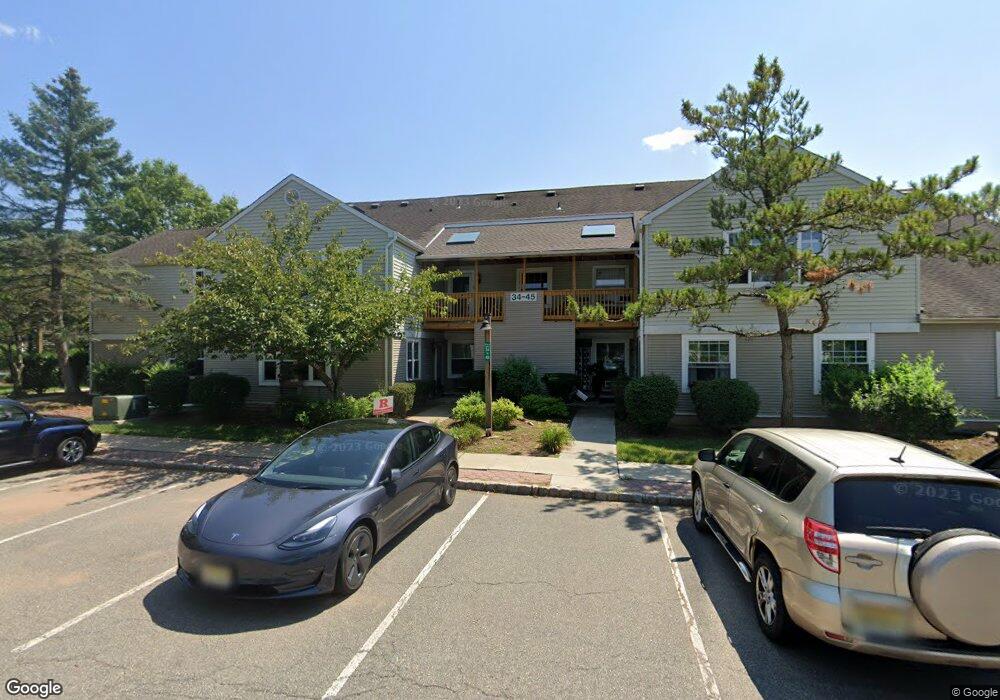
36 Cain Ct Bridgewater, NJ 08807
Green Knoll NeighborhoodEstimated Value: $168,443 - $211,000
About This Home
This home is located at 36 Cain Ct, Bridgewater, NJ 08807 and is currently estimated at $194,481, approximately $242 per square foot. 36 Cain Ct is a home located in Somerset County with nearby schools including Hamilton Primary School, Hillside Intermediate School, and Bridgewater-Raritan Middle School.
Ownership History
We collect this data history from publicly available records. To have your information removed, we recommend requesting removal directly through your county’s website.
Purchase Details
Home Financials for this Owner
Home Financials are based on the most recent Mortgage that was taken out on this home.Purchase Details
Home Financials for this Owner
Home Financials are based on the most recent Mortgage that was taken out on this home.Purchase Details
Home Financials for this Owner
Home Financials are based on the most recent Mortgage that was taken out on this home.Home Values in the Area
Average Home Value in this Area
Purchase History
We collect this data history from publicly available records. To have your information removed, we recommend requesting removal directly through your county’s website.
| Date | Buyer | Sale Price | Title Company |
|---|---|---|---|
| -- | First American Title | ||
| $128,000 | First American Title | ||
| $102,000 | -- |
Mortgage History
We collect this data history from publicly available records. To have your information removed, we recommend requesting removal directly through your county’s website.
| Date | Status | Borrower | Loan Amount |
|---|---|---|---|
| Closed | $0 | ||
| Open | $102,400 | ||
| Closed | $102,400 | ||
| Previous Owner | $96,900 |
Tax History
We collect this data history from publicly available records. To have your information removed, we recommend requesting removal directly through your county’s website.
| Year | Tax Paid | Tax Assessment Tax Assessment Total Assessment is a certain percentage of the fair market value that is determined by local assessors to be the total taxable value of land and additions on the property. | Land | Improvement |
|---|---|---|---|---|
| 2025 | $2,874 | $150,700 | $25,000 | $125,700 |
| 2024 | $2,874 | $147,300 | $25,000 | $122,300 |
| 2023 | $2,775 | $139,800 | $25,000 | $114,800 |
| 2022 | $2,628 | $128,000 | $25,000 | $103,000 |
| 2021 | $2,681 | $139,900 | $25,000 | $114,900 |
| 2020 | $2,902 | $138,600 | $25,000 | $113,600 |
| 2019 | $2,931 | $138,600 | $25,000 | $113,600 |
| 2018 | $2,916 | $138,200 | $25,000 | $113,200 |
| 2017 | $2,912 | $137,900 | $25,000 | $112,900 |
| 2016 | $2,866 | $137,700 | $25,000 | $112,700 |
| 2015 | $2,866 | $137,800 | $25,000 | $112,800 |
| 2014 | $2,910 | $137,800 | $25,000 | $112,800 |
Map
- 366 Pond Rd
- 179 Northfield Rd
- 273 Greenfield Rd
- 88 Woodlawn Ave
- 645 Foothill Rd
- 619 Foothill Rd
- 662 Foothill Rd
- 617 Foothill Rd
- 10 Thruway Dr
- 597 Foothill Rd
- 566 Glen Ridge Dr S
- 8 Yohn Dr
- 567 Foothill Rd
- 1530 Mountain Top Rd
- 59 Stella Dr
- 698 Foothill Rd
- 560 Rolling Hills Rd
- 1600 Mountain Top Rd
- 828 Star View Way
- 614 Talamini Rd
Ask me questions while you tour the home.