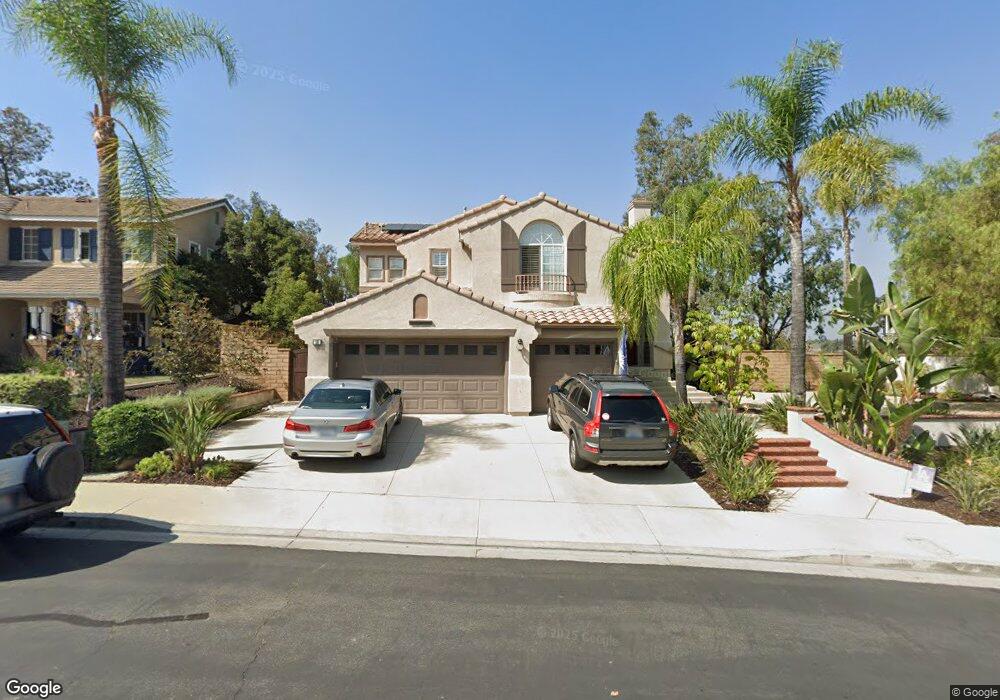
36 Castletree Rancho Santa Margarita, CA 92688
Las Flores NeighborhoodEstimated Value: $1,433,000 - $1,493,000
4
Beds
3
Baths
2,201
Sq Ft
$663/Sq Ft
Est. Value
About This Home
This home is located at 36 Castletree, Rancho Santa Margarita, CA 92688 and is currently estimated at $1,458,395, approximately $662 per square foot. 36 Castletree is a home located in Orange County with nearby schools including Las Flores Middle School, Tesoro High School, and St. Serra Catholic School.
Ownership History
Date
Name
Owned For
Owner Type
Purchase Details
Closed on
Mar 9, 2010
Sold by
Chamberlin Frank and Chamberlin Dorothy
Bought by
Romero Thomas and Romero Carrie
Current Estimated Value
Home Financials for this Owner
Home Financials are based on the most recent Mortgage that was taken out on this home.
Original Mortgage
$589,132
Outstanding Balance
$400,473
Interest Rate
5.5%
Mortgage Type
FHA
Estimated Equity
$1,057,922
Purchase Details
Closed on
Apr 20, 2001
Sold by
Marshall Gary M and Marshall Faye E
Bought by
Chamberlin Frank and Chamberlin Dorothy
Home Financials for this Owner
Home Financials are based on the most recent Mortgage that was taken out on this home.
Original Mortgage
$275,000
Interest Rate
7.14%
Purchase Details
Closed on
Sep 5, 1996
Sold by
Kaufman & Broad Coastal Inc
Bought by
Marshall Gary M and Marshall Faye E
Create a Home Valuation Report for This Property
The Home Valuation Report is an in-depth analysis detailing your home's value as well as a comparison with similar homes in the area
Home Values in the Area
Average Home Value in this Area
Purchase History
| Date | Buyer | Sale Price | Title Company |
|---|---|---|---|
| Romero Thomas | $600,000 | Equity Title Orange | |
| Chamberlin Frank | $445,000 | Equity Title Company | |
| Marshall Gary M | $240,500 | First American Title Ins Co |
Source: Public Records
Mortgage History
| Date | Status | Borrower | Loan Amount |
|---|---|---|---|
| Open | Romero Thomas | $589,132 | |
| Previous Owner | Chamberlin Frank | $275,000 |
Source: Public Records
Tax History Compared to Growth
Tax History
| Year | Tax Paid | Tax Assessment Tax Assessment Total Assessment is a certain percentage of the fair market value that is determined by local assessors to be the total taxable value of land and additions on the property. | Land | Improvement |
|---|---|---|---|---|
| 2025 | $7,668 | $774,488 | $439,600 | $334,888 |
| 2024 | $7,668 | $759,302 | $430,980 | $328,322 |
| 2023 | $7,495 | $744,414 | $422,529 | $321,885 |
| 2022 | $7,351 | $729,818 | $414,244 | $315,574 |
| 2021 | $8,240 | $715,508 | $406,121 | $309,387 |
| 2020 | $8,308 | $708,172 | $401,957 | $306,215 |
| 2019 | $8,902 | $694,287 | $394,076 | $300,211 |
| 2018 | $8,763 | $680,674 | $386,349 | $294,325 |
| 2017 | $9,160 | $667,328 | $378,774 | $288,554 |
| 2016 | $9,165 | $654,244 | $371,347 | $282,897 |
| 2015 | $9,251 | $644,417 | $365,769 | $278,648 |
| 2014 | $9,180 | $631,794 | $358,604 | $273,190 |
Source: Public Records
Map
Nearby Homes
- 19 Crestview Dr
- 8 Tradition Ln
- 94 Seacountry Ln
- 10 Summit Ct
- 104 Seacountry Ln
- 39 Legacy Way
- 27 Rolling Ridge
- 12 Poppyfield Ln
- 14 Poppyfield Ln
- 68 Radiance Ln
- 12 Bel Flora
- 25311 Misty Ridge
- 25145 Darlington
- 27911 Sheffield
- 10 Sillero
- 17 Mesquite
- 139 Melrose Dr
- 19 Sagebrush
- 30 Cascada
- 160 Via Lampara