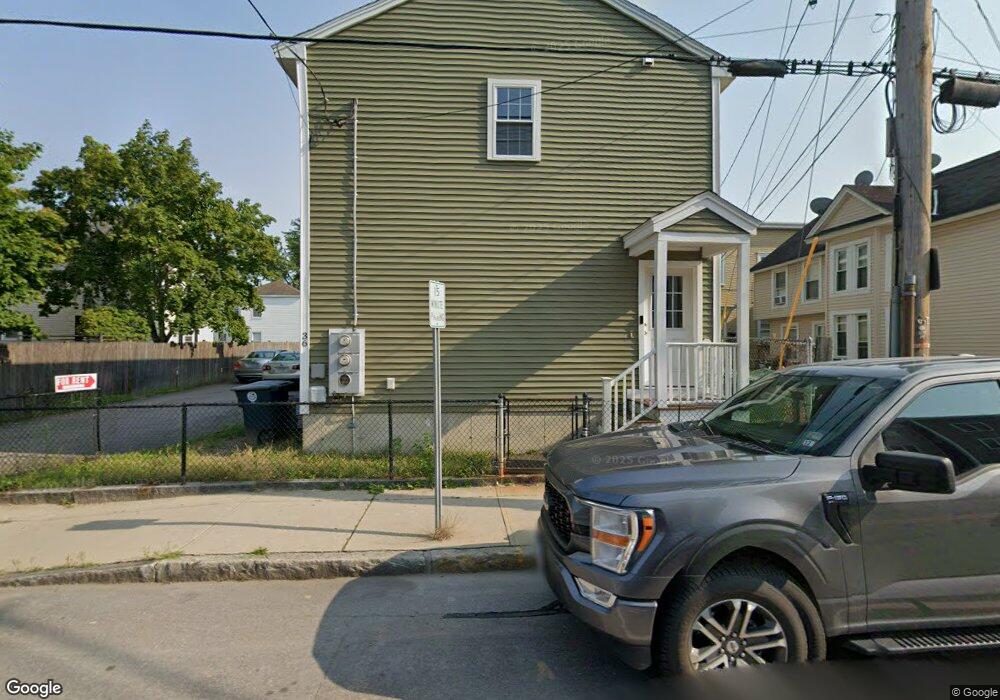
36 Central St Nashua, NH 03060
Mine Falls Park NeighborhoodEstimated Value: $589,000 - $768,528
6
Beds
4
Baths
2,622
Sq Ft
$244/Sq Ft
Est. Value
About This Home
This home is located at 36 Central St, Nashua, NH 03060 and is currently estimated at $639,632, approximately $243 per square foot. 36 Central St is a home located in Hillsborough County with nearby schools including Ledge Street Elementary School, Elm Street Middle School, and Nashua High School South.
Ownership History
Date
Name
Owned For
Owner Type
Purchase Details
Closed on
Mar 5, 2008
Sold by
Emc Mortgage Corp
Bought by
Min Pin Properties Llc
Current Estimated Value
Home Financials for this Owner
Home Financials are based on the most recent Mortgage that was taken out on this home.
Original Mortgage
$119,250
Interest Rate
5.57%
Mortgage Type
Purchase Money Mortgage
Purchase Details
Closed on
Aug 21, 2007
Sold by
Gagnon Daniel
Bought by
Emc Mortgage Corp
Purchase Details
Closed on
Jan 22, 2007
Sold by
Bilc Gabriel
Bought by
Gagnon Daniel
Home Financials for this Owner
Home Financials are based on the most recent Mortgage that was taken out on this home.
Original Mortgage
$285,950
Interest Rate
6.14%
Mortgage Type
Purchase Money Mortgage
Create a Home Valuation Report for This Property
The Home Valuation Report is an in-depth analysis detailing your home's value as well as a comparison with similar homes in the area
Home Values in the Area
Average Home Value in this Area
Purchase History
| Date | Buyer | Sale Price | Title Company |
|---|---|---|---|
| Min Pin Properties Llc | $132,500 | -- | |
| Emc Mortgage Corp | $205,000 | -- | |
| Gagnon Daniel | $301,000 | -- |
Source: Public Records
Mortgage History
| Date | Status | Borrower | Loan Amount |
|---|---|---|---|
| Open | Gagnon Daniel | $165,000 | |
| Closed | Gagnon Daniel | $119,250 | |
| Previous Owner | Gagnon Daniel | $285,950 |
Source: Public Records
Tax History
| Year | Tax Paid | Tax Assessment Tax Assessment Total Assessment is a certain percentage of the fair market value that is determined by local assessors to be the total taxable value of land and additions on the property. | Land | Improvement |
|---|---|---|---|---|
| 2025 | $11,729 | $696,900 | $120,500 | $576,400 |
| 2024 | $11,081 | $696,900 | $120,500 | $576,400 |
| 2023 | $10,466 | $574,100 | $96,400 | $477,700 |
| 2022 | $10,374 | $574,100 | $96,400 | $477,700 |
| 2021 | $8,972 | $386,400 | $61,000 | $325,400 |
| 2020 | $8,737 | $386,400 | $61,000 | $325,400 |
| 2019 | $8,408 | $386,400 | $61,000 | $325,400 |
| 2018 | $8,196 | $386,400 | $61,000 | $325,400 |
| 2017 | $3,340 | $129,500 | $51,800 | $77,700 |
| 2016 | $1,444 | $57,600 | $57,600 | $0 |
| 2015 | $1,413 | $57,600 | $57,600 | $0 |
| 2014 | $3,992 | $166,000 | $57,600 | $108,400 |
Source: Public Records
Map
Nearby Homes
- 14 Pleasant St
- 6 Buck St
- 22 Beech St
- 14 Mulberry St
- 18-20 Maple St
- 103 Ash St
- 5 Middle St
- 11 Charles St
- 169A W Hollis St Unit 193
- 17 1/2 Balcom St
- 24 E Otterson St
- 10 Saint Josephs Dr
- 5 Merrimack St
- 14 Artillery Ln Unit A
- 15 Lovell St Unit 17
- 57 Baldwin St
- 0 Baldwin St Unit 101, 102, 131, 100
- 19 Cross St
- 63 Tampa St
- 14 Acton St
- 36 Central St Unit B
- 36 Central St Unit A
- 34 Central St
- 40 Central St
- 40 Central St Unit 3A
- 36 Palm St Unit 36
- 38 Palm St
- 40 Palm St
- 18 Ash St Unit 24
- 33 Ash St
- 44 Palm St
- 35 Palm St
- 26 1/2 Ash St
- 39 1/2 Palm St
- 26 Ash St Unit 261/2
- 28 Central St Unit 30
- 28-30 Central St
- 35 Ash St
- 46 Palm St
- 46 Central St
Your Personal Tour Guide
Ask me questions while you tour the home.