Estimated Value: $1,033,734 - $1,290,000
3
Beds
2
Baths
2,180
Sq Ft
$526/Sq Ft
Est. Value
About This Home
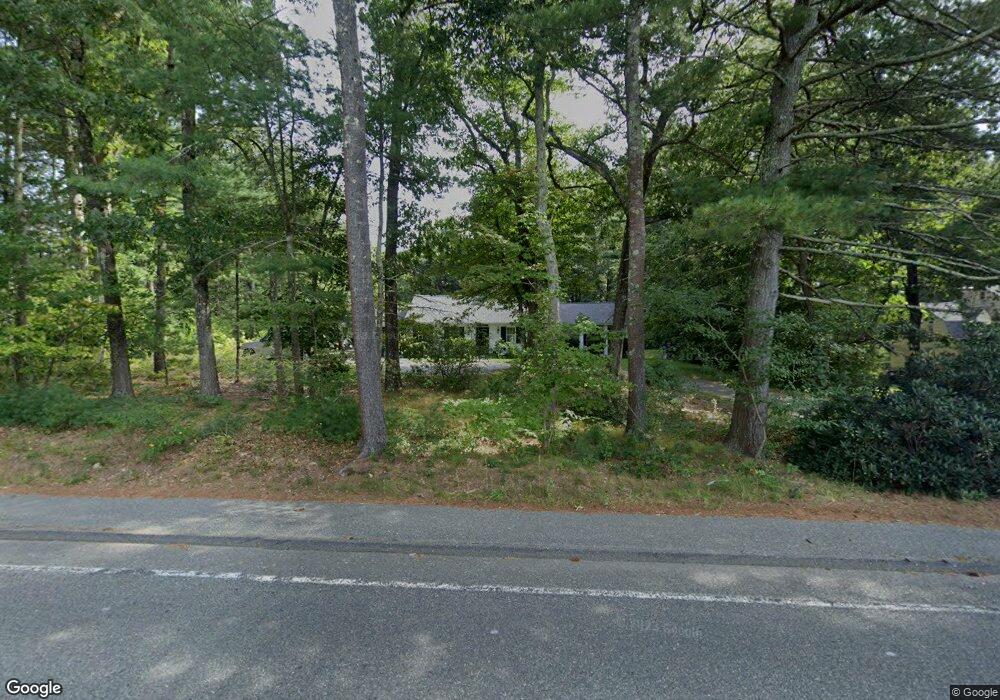
This home is located at 36 Centre St, Dover, MA 02030 and is currently estimated at $1,146,934, approximately $526 per square foot. 36 Centre St is a home located in Norfolk County with nearby schools including Chickering Elementary School, Dover-Sherborn Regional Middle School, and Dover-Sherborn Regional High School.
Ownership History
Date
Name
Owned For
Owner Type
Purchase Details
Closed on
Aug 2, 1993
Sold by
National Cu Admin
Bought by
Lothrop Jonathan D and Lothrop Karen M
Current Estimated Value
Home Financials for this Owner
Home Financials are based on the most recent Mortgage that was taken out on this home.
Original Mortgage
$189,000
Interest Rate
7.32%
Mortgage Type
Purchase Money Mortgage
Purchase Details
Closed on
Aug 17, 1992
Sold by
Mcintyre John P
Bought by
Natl Cu Admn
Purchase Details
Closed on
Nov 22, 1988
Sold by
Williams Craig
Bought by
Mcintyre John P
Create a Home Valuation Report for This Property
The Home Valuation Report is an in-depth analysis detailing your home's value as well as a comparison with similar homes in the area
Home Values in the Area
Average Home Value in this Area
Purchase History
| Date | Buyer | Sale Price | Title Company |
|---|---|---|---|
| Lothrop Jonathan D | $210,000 | -- | |
| Natl Cu Admn | $187,500 | -- | |
| Mcintyre John P | $300,000 | -- |
Source: Public Records
Mortgage History
| Date | Status | Borrower | Loan Amount |
|---|---|---|---|
| Open | Mcintyre John P | $210,000 | |
| Closed | Mcintyre John P | $240,000 | |
| Closed | Mcintyre John P | $189,000 |
Source: Public Records
Tax History
| Year | Tax Paid | Tax Assessment Tax Assessment Total Assessment is a certain percentage of the fair market value that is determined by local assessors to be the total taxable value of land and additions on the property. | Land | Improvement |
|---|---|---|---|---|
| 2025 | $9,157 | $812,500 | $594,800 | $217,700 |
| 2024 | $8,288 | $756,200 | $555,600 | $200,600 |
| 2023 | $8,172 | $670,400 | $485,400 | $185,000 |
| 2022 | $7,478 | $602,100 | $446,200 | $155,900 |
| 2021 | $6,872 | $533,100 | $387,400 | $145,700 |
| 2020 | $6,845 | $533,100 | $387,400 | $145,700 |
| 2019 | $6,731 | $520,600 | $387,400 | $133,200 |
| 2018 | $6,568 | $511,500 | $387,400 | $124,100 |
| 2017 | $6,239 | $478,100 | $338,400 | $139,700 |
| 2016 | $5,952 | $462,100 | $328,600 | $133,500 |
| 2015 | $6,281 | $494,600 | $358,000 | $136,600 |
Source: Public Records
Map
Nearby Homes
Your Personal Tour Guide
Ask me questions while you tour the home.