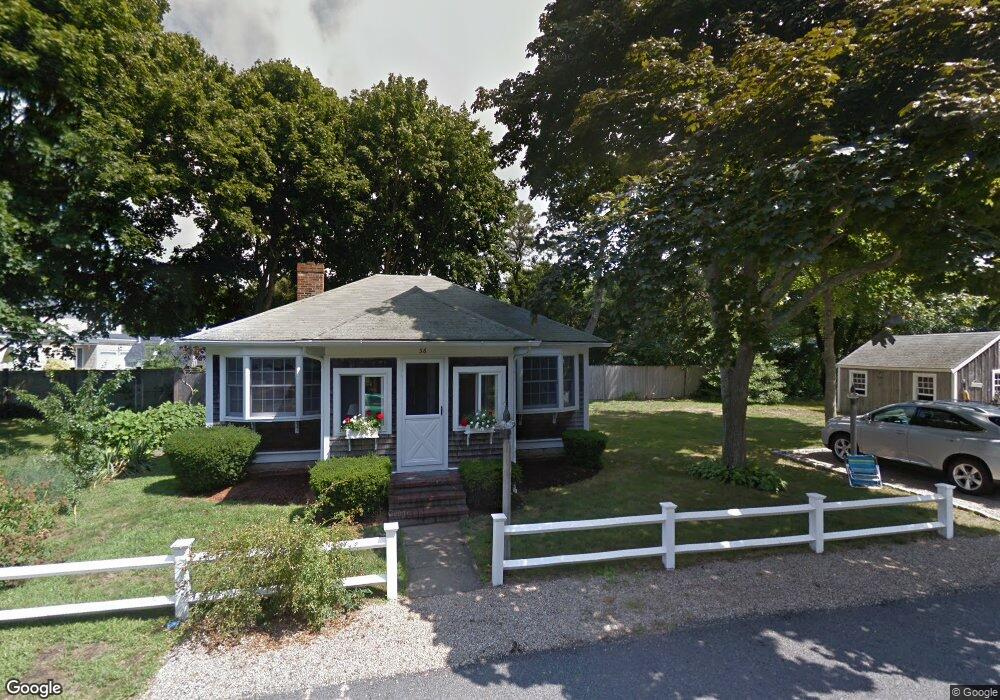
36 Chase Ave West Dennis, MA 02670
West Dennis NeighborhoodEstimated Value: $733,000 - $873,520
3
Beds
2
Baths
1,244
Sq Ft
$671/Sq Ft
Est. Value
About This Home
This home is located at 36 Chase Ave, West Dennis, MA 02670 and is currently estimated at $834,380, approximately $670 per square foot. 36 Chase Ave is a home located in Barnstable County with nearby schools including Dennis-Yarmouth Regional High School and St. Pius X. School.
Ownership History
Date
Name
Owned For
Owner Type
Purchase Details
Closed on
Oct 24, 2019
Sold by
Doe Barbara K
Bought by
Barbara Doe Rt
Current Estimated Value
Purchase Details
Closed on
Aug 11, 2004
Sold by
Arone James P and Arone Joseph A
Bought by
Arone James P and Flynn Kathleen
Home Financials for this Owner
Home Financials are based on the most recent Mortgage that was taken out on this home.
Original Mortgage
$260,000
Interest Rate
6.16%
Purchase Details
Closed on
Jun 8, 1984
Bought by
Doe Barbara K
Create a Home Valuation Report for This Property
The Home Valuation Report is an in-depth analysis detailing your home's value as well as a comparison with similar homes in the area
Home Values in the Area
Average Home Value in this Area
Purchase History
| Date | Buyer | Sale Price | Title Company |
|---|---|---|---|
| Barbara Doe Rt | -- | -- | |
| Arone James P | -- | -- | |
| Doe Barbara K | $60,000 | -- |
Source: Public Records
Mortgage History
| Date | Status | Borrower | Loan Amount |
|---|---|---|---|
| Previous Owner | Arone James P | $260,000 |
Source: Public Records
Tax History Compared to Growth
Tax History
| Year | Tax Paid | Tax Assessment Tax Assessment Total Assessment is a certain percentage of the fair market value that is determined by local assessors to be the total taxable value of land and additions on the property. | Land | Improvement |
|---|---|---|---|---|
| 2025 | $3,447 | $796,100 | $266,700 | $529,400 |
| 2024 | $3,302 | $752,100 | $256,500 | $495,600 |
| 2023 | $3,187 | $682,400 | $226,700 | $455,700 |
| 2022 | $3,134 | $559,700 | $221,700 | $338,000 |
| 2021 | $3,166 | $525,100 | $217,300 | $307,800 |
| 2020 | $3,188 | $522,600 | $240,200 | $282,400 |
| 2019 | $2,590 | $419,700 | $168,200 | $251,500 |
| 2018 | $2,885 | $455,000 | $224,200 | $230,800 |
| 2017 | $2,425 | $394,300 | $170,800 | $223,500 |
| 2016 | $2,553 | $391,000 | $197,500 | $193,500 |
| 2015 | $1,779 | $278,000 | $197,500 | $80,500 |
| 2014 | $1,562 | $246,000 | $165,500 | $80,500 |
Source: Public Records
Map
Nearby Homes
- 2 Rita Mary Way
- 308 Old Main St
- 14 Schoolhouse Ln
- 209 Main St Unit 3
- 209 Main St Unit 6
- 209 Main St Unit 1
- 209 Main St Unit 2
- 209 Main St Unit 4
- 209 Main St Unit 5
- 181 Pleasant St
- 45 Seth Ln
- 40 Kelley Rd
- 23 Doric Ave
- 22 Powhatan Rd
- 29 Bass River Rd
- 178 School St
- 18 Turner Ln
- 15 Sharon Rd
- 116 N Main St
- 7 Sunset Pines Rd
- 36 Chase Ave
- 88 Chase Ave
- 21 Chase Ave
- 100 Uncle Barneys Rd
- 96B Uncle Barneys Rd
- 21 Chase Ave
- 60 Chase Ave
- 76 Chase Ave
- 82 Chase Ave
- 56 Chase Ave
- 96-B Uncle Barneys Rd
- 94-A Uncle Barneys Rd
- 28 Chase Ave
- 112 Uncle Barneys Rd
- 61 Chase Ave
- 79 Chase Ave
- 67 Chase Ave
- 57 Chase Ave
- 46 Chase Ave
- 22 Chase Ave