NOT LISTED FOR SALE

36 Clarke Rd Narragansett, RI 02882

Estimated Value: $630,000 - $828,000

1 Bed
2 Baths
1,040 Sq Ft
$729/Sq Ft Est. Value

Last Sold September 03, 2015

Last sale price $435,000 $418 Per Sq Ft

Est. 74% increase in value since last sale

Current estimated payment $4,409/month

About This Home

As of September 2015

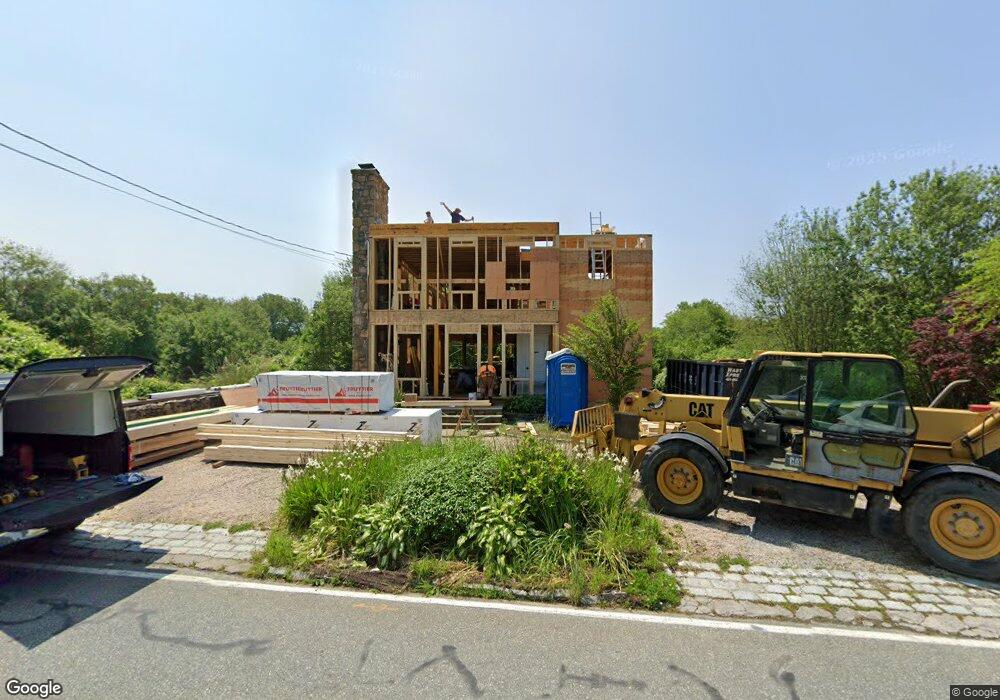
Walk to the Beach! EXPANSION POSSIBILITIES! Situated on quiet road that offers pure privacy! Tranquil flowing stream with bridge, beautifully landscaped perennial gardens during Spring, Summer, Fall. A plethora of wildlife to view in your backyard.

Ownership History

Date Name Owned For Owner Type

Purchase Details

Closed on
Nov 19, 2009
Sold by
Chronley David J
Bought by
Chronley David J and Chronley Marianne K
Current Estimated Value
$758,134

Purchase Details

Closed on
Jan 27, 2006
Sold by
Laurie Joseph F
Bought by
Chronley David J
Source: Public Records

Range of Values:

Collateral Analytics

Collateral Analytics Collateral Analytics AVMs (Automated Valuation Model) employ a number of statistical approaches combined with neighborhood-specific comparable selection guarantees the most up-to-date and precise valuations.

Not Available

Collateral Analytics does not have data for the current month. Please view the chart for historical values.

ICE

ICE Mortgage Technology ICE Mortgage Technology’s AVM (Automated Valuation Model) is a state-of-the-art online residential property valuation tool that provides a quick and accurate estimate of the value of almost any home in the U.S.

Not Available

ICE Mortgage Technology does not have data for the current month. Please view the chart for historical values.

First American

First American First American Data & Analytics’ next-generation AVM combines unrivaled data assets with a blended ensemble of valuation models to produce highly accurate, reliable valuations you can trust.

Not Available

First American does not have data for the current month. Please view the chart for historical values.

Quantarium

Quantarium Quantarium’s valuation service, repeatedly proven the industry’s most accurate and comprehensive, is supercharged with a self-learning and auto-tuning AI engine that continually becomes smarter and more accurate as it processes daily inputs from the industry’s leading RE data lake.

Not Available

Quantarium does not have data for the current month. Please view the chart for historical values.

Average Value
Not Available
List Price
Sold Price
Create a Home Valuation Report for This Property
The Home Valuation Report is an in-depth analysis detailing your home's value as well as a comparison with similar homes in the area

Home Values in the Area

Source: Public Records

Average Home Value in this Area


Source: Public Records

Purchase History

Date Buyer Sale Price Title Company
Chronley David J -- --
Chronley David J $200,000 --
Source: Public Records

Mortgage History

Date Status Borrower Loan Amount
Open Chronley David J $102,700
Previous Owner Chronley David J $250,000
Source: Public Records

Property History

Date Event Price List to Sale Price per Sq Ft Prior Sale
09/03/2015 09/03/15 Sold $435,000 -13.0% $418 / Sq Ft View Prior Sale
08/04/2015 08/04/15 Pending -- -- --
04/15/2015 04/15/15 For Sale $500,000 -- $481 / Sq Ft

Tax History Compared to Growth

Source: Public Records

Tax History

Year Tax Paid Tax Assessment Tax Assessment Total Assessment is a certain percentage of the fair market value that is determined by local assessors to be the total taxable value of land and additions on the property. Land Improvement
2024 $4,482 $684,200 $301,300 $382,900
2023 $4,365 $468,800 $194,400 $274,400
2022 $4,219 $468,800 $194,400 $274,400
2021 $4,154 $468,800 $194,400 $274,400
2020 $4,062 $387,600 $166,400 $221,200
2019 $3,965 $387,600 $166,400 $221,200
2018 $3,857 $387,600 $166,400 $221,200
2017 $3,810 $360,800 $151,300 $209,500
2016 $3,637 $360,800 $151,300 $209,500
2015 $3,586 $360,800 $151,300 $209,500
2014 $3,552 $353,800 $151,300 $202,500
Source: Public Records

Agents Affiliated with this Home

  • Section Image
  • Section Image
See All Agents

Map