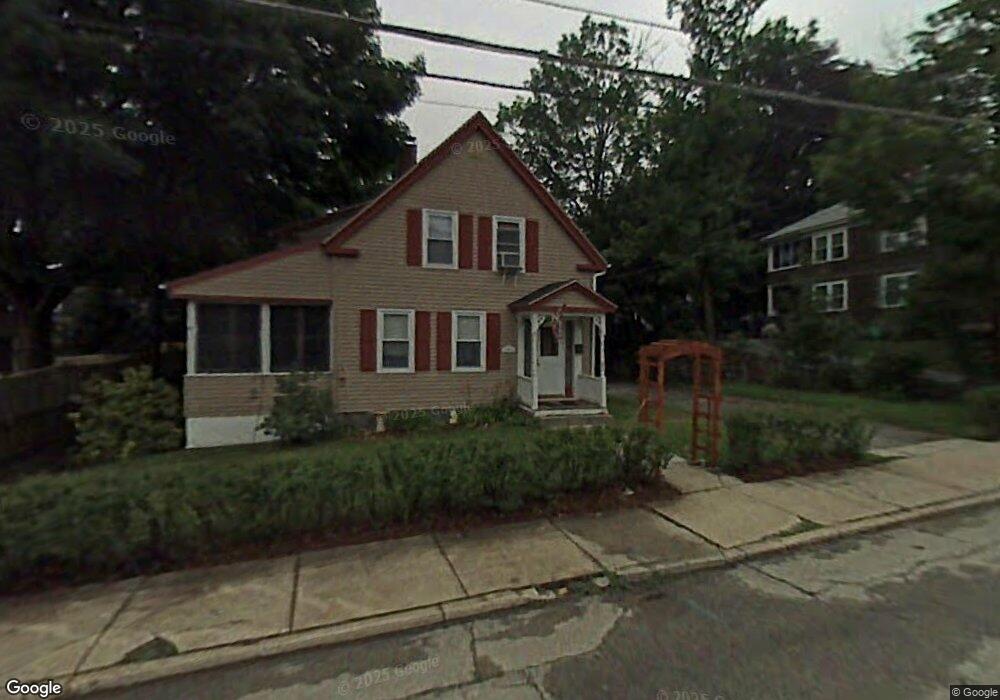
36 Cross St Nashua, NH 03064
North End Nashua NeighborhoodEstimated Value: $418,000 - $460,000
4
Beds
2
Baths
1,545
Sq Ft
$286/Sq Ft
Est. Value
About This Home
This home is located at 36 Cross St, Nashua, NH 03064 and is currently estimated at $441,633, approximately $285 per square foot. 36 Cross St is a home located in Hillsborough County with nearby schools including Mount Pleasant Elementary School, Pennichuck Middle School, and Nashua High School North.
Ownership History
Date
Name
Owned For
Owner Type
Purchase Details
Closed on
Oct 6, 2000
Sold by
Francoeur Ricky and Francoeur Stephani D
Bought by
Thellen Steven T
Current Estimated Value
Home Financials for this Owner
Home Financials are based on the most recent Mortgage that was taken out on this home.
Original Mortgage
$134,500
Outstanding Balance
$48,534
Interest Rate
7.96%
Mortgage Type
VA
Estimated Equity
$393,099
Purchase Details
Closed on
Oct 7, 1996
Sold by
Foley Phyllis W
Bought by
Francoeur Ricky L and Francoeur Stephani D
Home Financials for this Owner
Home Financials are based on the most recent Mortgage that was taken out on this home.
Original Mortgage
$60,850
Interest Rate
7.9%
Mortgage Type
Purchase Money Mortgage
Create a Home Valuation Report for This Property
The Home Valuation Report is an in-depth analysis detailing your home's value as well as a comparison with similar homes in the area
Home Values in the Area
Average Home Value in this Area
Purchase History
| Date | Buyer | Sale Price | Title Company |
|---|---|---|---|
| Thellen Steven T | $132,900 | -- | |
| Francoeur Ricky L | $60,000 | -- |
Source: Public Records
Mortgage History
| Date | Status | Borrower | Loan Amount |
|---|---|---|---|
| Open | Francoeur Ricky L | $134,500 | |
| Previous Owner | Francoeur Ricky L | $60,850 |
Source: Public Records
Tax History Compared to Growth
Tax History
| Year | Tax Paid | Tax Assessment Tax Assessment Total Assessment is a certain percentage of the fair market value that is determined by local assessors to be the total taxable value of land and additions on the property. | Land | Improvement |
|---|---|---|---|---|
| 2024 | $6,106 | $384,000 | $115,800 | $268,200 |
| 2023 | $6,045 | $331,600 | $92,600 | $239,000 |
| 2022 | $5,992 | $331,600 | $92,600 | $239,000 |
| 2021 | $5,071 | $218,400 | $61,800 | $156,600 |
| 2020 | $4,735 | $209,400 | $61,800 | $147,600 |
| 2019 | $4,557 | $209,400 | $61,800 | $147,600 |
| 2018 | $4,441 | $209,400 | $61,800 | $147,600 |
| 2017 | $4,214 | $163,400 | $55,100 | $108,300 |
| 2016 | $4,096 | $163,400 | $55,100 | $108,300 |
| 2015 | $4,008 | $163,400 | $55,100 | $108,300 |
| 2014 | $3,930 | $163,400 | $55,100 | $108,300 |
Source: Public Records
Map
Nearby Homes
- 15 Atherton Ave
- 13 Sapphire Ln
- 19 Atherton Ave
- 36-38 Courtland St
- 71 Concord St
- 11 Charles St
- 21 Edson St
- 4 Reservoir St
- 61 Manchester St
- 18 Harbor Ave Unit 208
- 5 Mulberry St
- 13 Mulvanity St
- 38 Central St
- 0 Baldwin St
- 4 Chase St
- 19 Bartlett Ave
- 73 Berkeley St
- 31 Juliana Ave
- 31 Juliana Ave Unit 4
- 24 E Otterson St
- 38 Cross St Unit 40
- 37 Cross St
- 57 Kendrick St
- 39 Cross St
- 33 Cross St Unit 35
- 56 Lock St
- 9 Kendrick St
- 50 Lock St
- 48 Lock St
- 41 Cross St Unit 411/2
- 41 Cross St Unit 4
- 41 Cross St Unit 5
- 58 Lock St
- 42 Cross St
- 2 1/2 Kendrick St
- 4 Kendrick St
- 44 1/2 Kendrick St
- 2 Kendrick St
- 2 Kendrick St Unit 1
- 22 1/2 Kendrick St