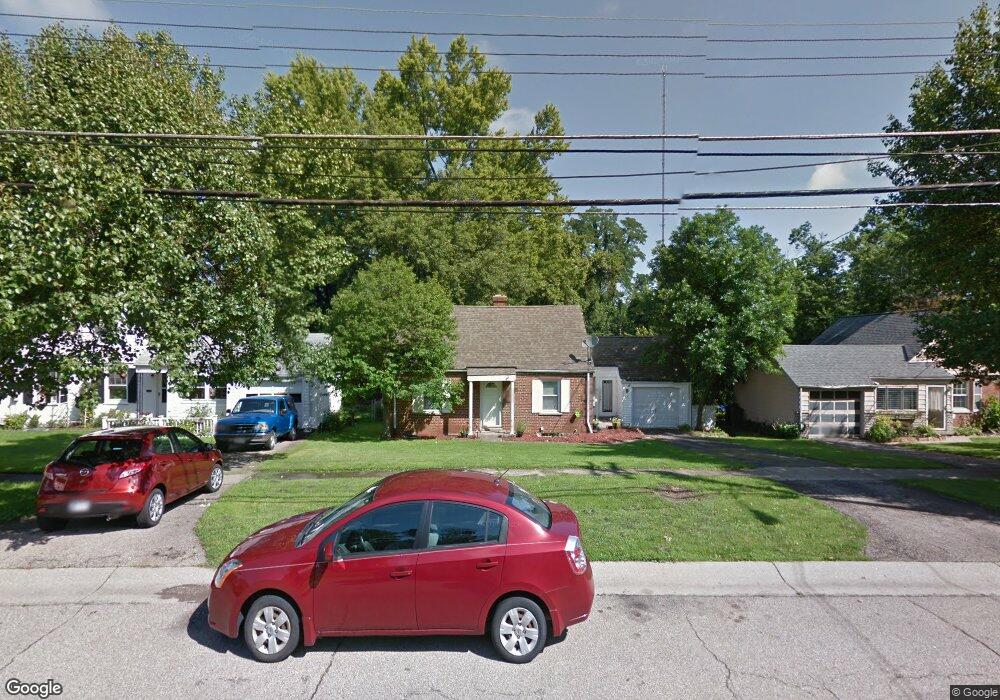
36 Damon Rd Cincinnati, OH 45218
Estimated Value: $204,000 - $235,288
4
Beds
2
Baths
2,056
Sq Ft
$105/Sq Ft
Est. Value
About This Home
This home is located at 36 Damon Rd, Cincinnati, OH 45218 and is currently estimated at $216,822, approximately $105 per square foot. 36 Damon Rd is a home located in Hamilton County with nearby schools including Central Montessori Academy.
Ownership History
Date
Name
Owned For
Owner Type
Purchase Details
Closed on
Aug 27, 2014
Sold by
Aldoud Jrouh and Aldoud Abeer
Bought by
Salem Fahed and Salem Mariam
Current Estimated Value
Purchase Details
Closed on
Jan 30, 2012
Sold by
Salem Mariam
Bought by
Aloud Jrouh
Purchase Details
Closed on
Jul 13, 2011
Sold by
Citibank Na
Bought by
Salem Mariam
Purchase Details
Closed on
Nov 24, 2010
Sold by
Kraimer William J
Bought by
Citi Bank Na
Purchase Details
Closed on
Oct 25, 2006
Sold by
Reuter Natalie A
Bought by
Kraimer William J
Purchase Details
Closed on
May 31, 2000
Sold by
Farfsing Jean R
Bought by
Reuter Natalie A
Create a Home Valuation Report for This Property
The Home Valuation Report is an in-depth analysis detailing your home's value as well as a comparison with similar homes in the area
Home Values in the Area
Average Home Value in this Area
Purchase History
| Date | Buyer | Sale Price | Title Company |
|---|---|---|---|
| Salem Fahed | -- | Prodigy Title Agency | |
| Aloud Jrouh | -- | Attorney | |
| Salem Mariam | $45,000 | Prism Title & Closing Servic | |
| Citi Bank Na | $50,000 | None Available | |
| Kraimer William J | $84,000 | None Available | |
| Reuter Natalie A | $95,000 | -- |
Source: Public Records
Tax History
| Year | Tax Paid | Tax Assessment Tax Assessment Total Assessment is a certain percentage of the fair market value that is determined by local assessors to be the total taxable value of land and additions on the property. | Land | Improvement |
|---|---|---|---|---|
| 2025 | $4,282 | $57,691 | $9,667 | $48,024 |
| 2024 | $4,059 | $57,691 | $9,667 | $48,024 |
| 2023 | $3,728 | $57,691 | $9,667 | $48,024 |
| 2022 | $3,440 | $39,824 | $8,390 | $31,434 |
| 2021 | $3,441 | $39,824 | $8,390 | $31,434 |
| 2020 | $3,402 | $39,824 | $8,390 | $31,434 |
| 2019 | $3,325 | $34,038 | $7,172 | $26,866 |
| 2018 | $3,329 | $34,038 | $7,172 | $26,866 |
| 2017 | $3,134 | $34,038 | $7,172 | $26,866 |
| 2016 | $1,386 | $14,333 | $7,851 | $6,482 |
| 2015 | $1,289 | $14,333 | $7,851 | $6,482 |
| 2014 | $1,317 | $14,333 | $7,851 | $6,482 |
| 2013 | $1,400 | $15,751 | $8,628 | $7,123 |
Source: Public Records
Map
Nearby Homes
- 9 Dewitt Ct
- 7 Dewitt Ct
- 11 Dewitt Ct
- 48 Damon Rd
- 29 Dayspring Terrace
- 6 Chalmers Ct
- 6 Belknap Place 1
- 34 Gambier Cir
- 31 Flanders Ln
- 11 Ashby St
- 23 Briarwood Ln
- 1 Jennings Rd
- 16 Japonica Dr
- 38 Handel Ln
- 37 Hayden Dr
- 1314 Waycross Rd
- 1413 Waycross Rd
- 11315 Lincolnshire Dr
- 1105 Inner Circle Dr
- 1477 Kelvin Ct
Your Personal Tour Guide
Ask me questions while you tour the home.