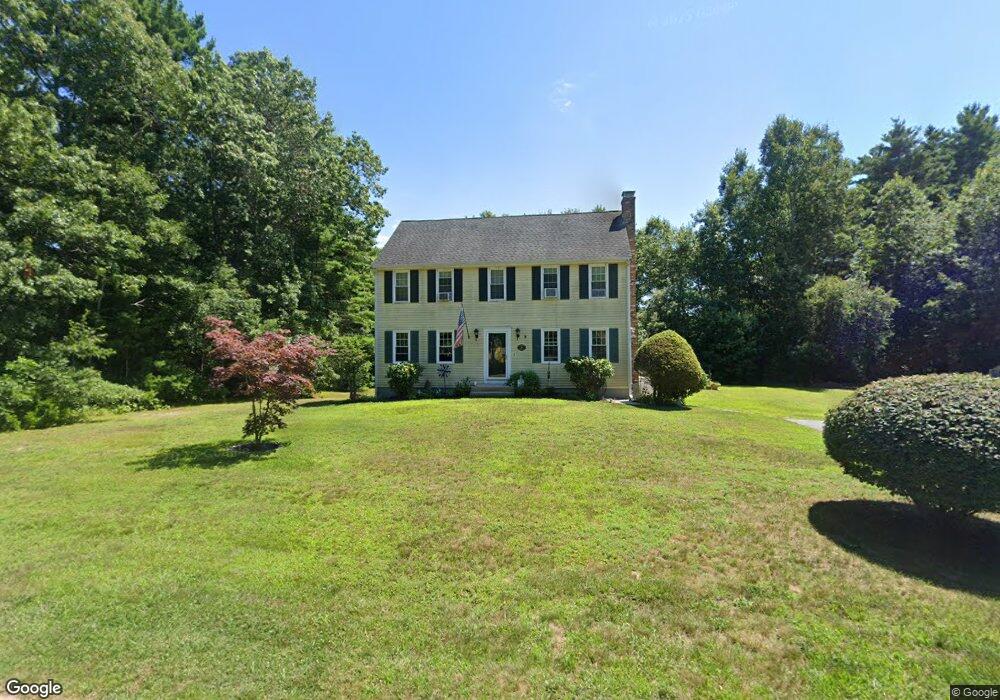
36 Dinahs Way Wareham, MA 02571
Estimated Value: $584,000 - $664,000
3
Beds
3
Baths
1,748
Sq Ft
$356/Sq Ft
Est. Value
About This Home
This home is located at 36 Dinahs Way, Wareham, MA 02571 and is currently estimated at $621,594, approximately $355 per square foot. 36 Dinahs Way is a home located in Plymouth County with nearby schools including Tabor Academy.
Ownership History
Date
Name
Owned For
Owner Type
Purchase Details
Closed on
Mar 24, 2003
Sold by
Baptiste Kenneth J and Baptiste Kathleen D
Bought by
Holbrook Mark J and Holbrook Christine M
Current Estimated Value
Home Financials for this Owner
Home Financials are based on the most recent Mortgage that was taken out on this home.
Original Mortgage
$235,000
Interest Rate
5.9%
Mortgage Type
Purchase Money Mortgage
Purchase Details
Closed on
Mar 30, 1995
Sold by
Theodore Elaine M
Bought by
Baptiste Kenneth J and Baptiste Kathleen D
Create a Home Valuation Report for This Property
The Home Valuation Report is an in-depth analysis detailing your home's value as well as a comparison with similar homes in the area
Purchase History
| Date | Buyer | Sale Price | Title Company |
|---|---|---|---|
| Holbrook Mark J | $265,000 | -- | |
| Holbrook Mark J | $265,000 | -- | |
| Baptiste Kenneth J | $139,900 | -- | |
| Baptiste Kenneth J | $139,900 | -- |
Source: Public Records
Mortgage History
| Date | Status | Borrower | Loan Amount |
|---|---|---|---|
| Open | Baptiste Kenneth J | $25,000 | |
| Open | Baptiste Kenneth J | $237,600 | |
| Closed | Baptiste Kenneth J | $235,000 |
Source: Public Records
Tax History
| Year | Tax Paid | Tax Assessment Tax Assessment Total Assessment is a certain percentage of the fair market value that is determined by local assessors to be the total taxable value of land and additions on the property. | Land | Improvement |
|---|---|---|---|---|
| 2025 | $5,061 | $485,700 | $137,200 | $348,500 |
| 2024 | $5,041 | $448,900 | $109,900 | $339,000 |
| 2023 | $4,802 | $399,200 | $100,300 | $298,900 |
| 2022 | $4,497 | $341,200 | $100,300 | $240,900 |
| 2021 | $0 | $329,200 | $100,300 | $228,900 |
| 2020 | $0 | $313,200 | $100,300 | $212,900 |
| 2019 | $3,999 | $300,900 | $103,400 | $197,500 |
| 2018 | $3,838 | $281,600 | $103,400 | $178,200 |
| 2017 | $3,632 | $270,000 | $103,400 | $166,600 |
| 2016 | $3,281 | $242,500 | $99,200 | $143,300 |
| 2015 | $3,169 | $242,500 | $99,200 | $143,300 |
| 2014 | $3,328 | $259,000 | $108,200 | $150,800 |
Source: Public Records
Map
Nearby Homes
- 6 Bourne Terrace
- 233 Marion Rd
- 10 Longmeadow Dr
- 7 Maud Palmer Dr
- 15 14th Ave
- 1 Emma Ln Unit B
- 437 Main St
- 9 Woodville Way
- 19 Station St
- 17 Station St
- 4 Mather Dr
- 110 Mayflower Ridge Dr
- 15 Broadmarsh Ave
- 2645 Cranberry Hwy Unit A
- 6 Allen Ave
- 20 Grant St
- 6 Wildwood Ave
- 14 Briarwood Dr
- 43 Shore Ave
- 189 Pine View Terrace
Your Personal Tour Guide
Ask me questions while you tour the home.