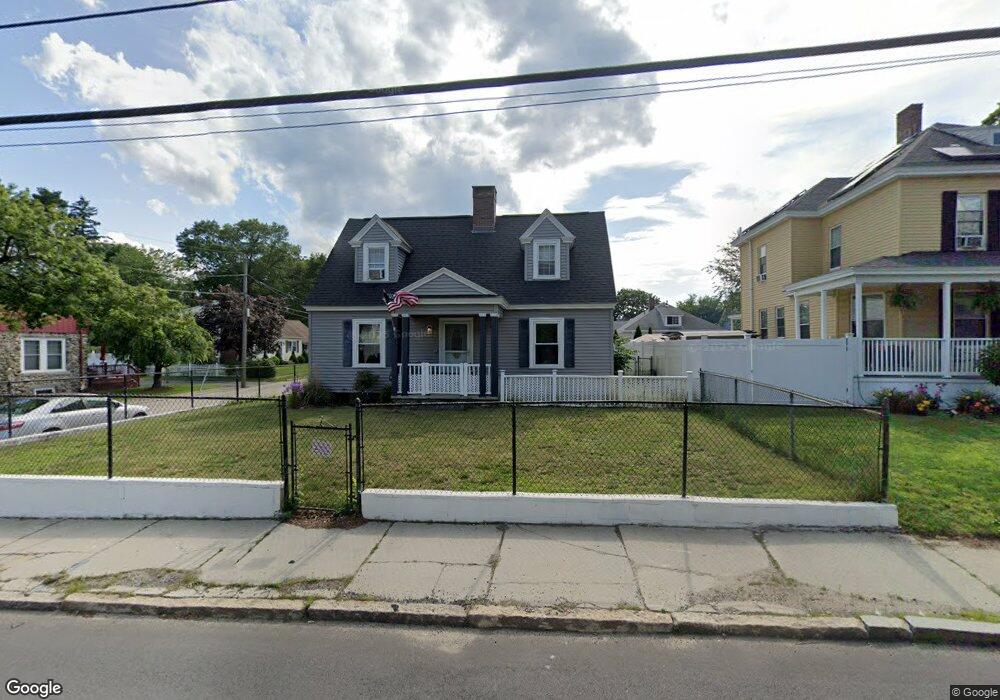
36 Elm St Methuen, MA 01844
Downtown Methuen NeighborhoodEstimated Value: $544,000 - $612,000
2
Beds
2
Baths
2,011
Sq Ft
$285/Sq Ft
Est. Value
About This Home
This home is located at 36 Elm St, Methuen, MA 01844 and is currently estimated at $573,752, approximately $285 per square foot. 36 Elm St is a home located in Essex County with nearby schools including Tenney Grammar School, Methuen High School, and Lawrence Family Development Charter School.
Ownership History
Date
Name
Owned For
Owner Type
Purchase Details
Closed on
Mar 24, 2023
Sold by
Macnally-Sullivan Andrea
Bought by
Macnally-Sullivan Andrea and Sullivan Michael V
Current Estimated Value
Home Financials for this Owner
Home Financials are based on the most recent Mortgage that was taken out on this home.
Original Mortgage
$248,000
Outstanding Balance
$240,205
Interest Rate
6.32%
Mortgage Type
New Conventional
Estimated Equity
$333,547
Purchase Details
Closed on
Sep 7, 2005
Sold by
Clements Michael and Clements Julie E
Bought by
Macnally Andrea
Home Financials for this Owner
Home Financials are based on the most recent Mortgage that was taken out on this home.
Original Mortgage
$224,000
Interest Rate
5.79%
Mortgage Type
Purchase Money Mortgage
Create a Home Valuation Report for This Property
The Home Valuation Report is an in-depth analysis detailing your home's value as well as a comparison with similar homes in the area
Home Values in the Area
Average Home Value in this Area
Purchase History
| Date | Buyer | Sale Price | Title Company |
|---|---|---|---|
| Macnally-Sullivan Andrea | -- | None Available | |
| Macnally-Sullivan Andrea | -- | None Available | |
| Macnally-Sullivan Andrea | -- | None Available | |
| Macnally Andrea | $280,000 | -- | |
| Macnally Andrea | $280,000 | -- |
Source: Public Records
Mortgage History
| Date | Status | Borrower | Loan Amount |
|---|---|---|---|
| Open | Macnally-Sullivan Andrea | $248,000 | |
| Closed | Macnally-Sullivan Andrea | $248,000 | |
| Previous Owner | Macnally Andrea | $224,000 |
Source: Public Records
Tax History
| Year | Tax Paid | Tax Assessment Tax Assessment Total Assessment is a certain percentage of the fair market value that is determined by local assessors to be the total taxable value of land and additions on the property. | Land | Improvement |
|---|---|---|---|---|
| 2025 | $4,719 | $446,000 | $174,200 | $271,800 |
| 2024 | $4,529 | $417,000 | $145,200 | $271,800 |
| 2023 | $4,428 | $378,500 | $145,200 | $233,300 |
| 2022 | $4,171 | $319,600 | $118,800 | $200,800 |
| 2021 | $3,956 | $299,900 | $112,200 | $187,700 |
| 2020 | $3,961 | $294,700 | $112,200 | $182,500 |
| 2019 | $3,841 | $270,700 | $105,600 | $165,100 |
| 2018 | $3,662 | $256,600 | $99,000 | $157,600 |
| 2017 | $3,531 | $241,000 | $99,000 | $142,000 |
| 2016 | $3,180 | $214,700 | $85,800 | $128,900 |
| 2015 | $3,040 | $208,200 | $85,800 | $122,400 |
Source: Public Records
Map
Nearby Homes
- 88-90 Columbus Ave
- 14-16 Cypress Ave
- 42-44 Cypress Ave
- 767 Riverside Dr
- 65 Clayton Ave
- 1100 Essex St
- 1082 Essex St
- 1146 Essex St
- 50 Forest St
- 37 Maplewood Ave
- 1008 Essex St Unit 1010
- 70 Butler St
- 62-66 Butler St
- 20-22 Ashland Ave
- 20 Ruskin Ave
- 179-181 West St
- 23 Chase St
- 24 Railroad St
- 36 Manchester St
- 8-10 Elsmere Ave
Your Personal Tour Guide
Ask me questions while you tour the home.