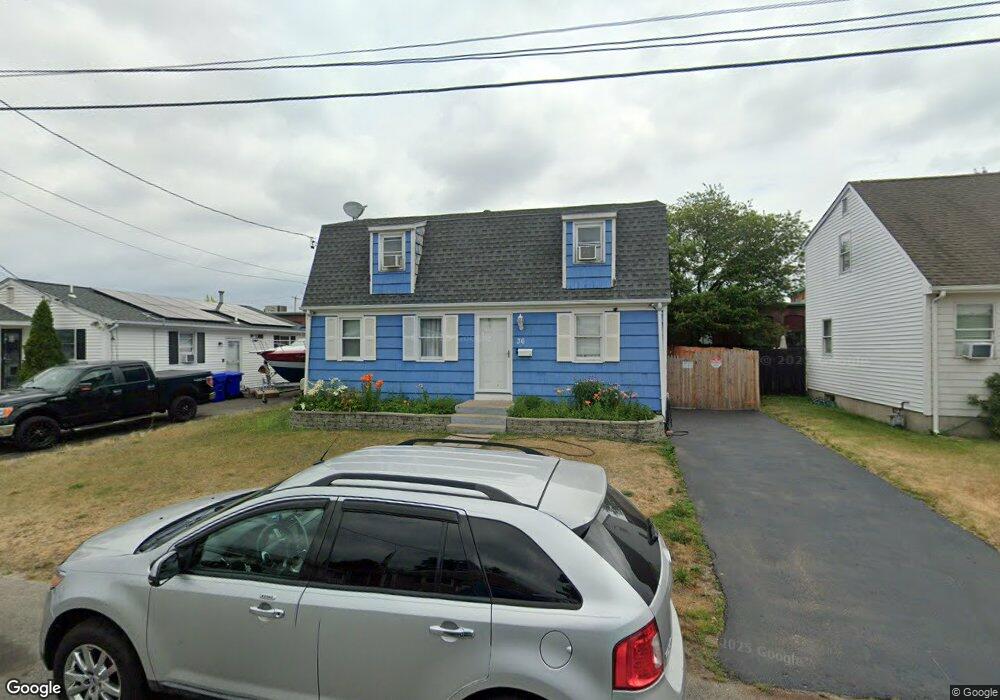
36 Field St Pawtucket, RI 02860
Beverage Hill-The Plains NeighborhoodEstimated Value: $394,000 - $467,000
3
Beds
2
Baths
1,536
Sq Ft
$274/Sq Ft
Est. Value
About This Home
This home is located at 36 Field St, Pawtucket, RI 02860 and is currently estimated at $420,246, approximately $273 per square foot. 36 Field St is a home located in Providence County with nearby schools including International Charter School, Blackstone Academy Charter School, and Saint Teresa Catholic Elementary School.
Ownership History
Date
Name
Owned For
Owner Type
Purchase Details
Closed on
Feb 26, 1999
Sold by
Mello Joseph
Bought by
Berrio Mario O and Berrio Brigitte
Current Estimated Value
Home Financials for this Owner
Home Financials are based on the most recent Mortgage that was taken out on this home.
Original Mortgage
$87,730
Outstanding Balance
$20,383
Interest Rate
6.78%
Estimated Equity
$399,863
Create a Home Valuation Report for This Property
The Home Valuation Report is an in-depth analysis detailing your home's value as well as a comparison with similar homes in the area
Home Values in the Area
Average Home Value in this Area
Purchase History
| Date | Buyer | Sale Price | Title Company |
|---|---|---|---|
| Berrio Mario O | $88,500 | -- |
Source: Public Records
Mortgage History
| Date | Status | Borrower | Loan Amount |
|---|---|---|---|
| Open | Berrio Mario O | $6,000 | |
| Open | Berrio Mario O | $87,730 | |
| Previous Owner | Berrio Mario O | $71,000 |
Source: Public Records
Tax History Compared to Growth
Tax History
| Year | Tax Paid | Tax Assessment Tax Assessment Total Assessment is a certain percentage of the fair market value that is determined by local assessors to be the total taxable value of land and additions on the property. | Land | Improvement |
|---|---|---|---|---|
| 2025 | $3,950 | $300,400 | $125,800 | $174,600 |
| 2024 | $3,707 | $300,400 | $125,800 | $174,600 |
| 2023 | $4,259 | $251,400 | $76,500 | $174,900 |
| 2022 | $4,168 | $251,400 | $76,500 | $174,900 |
| 2021 | $4,168 | $251,400 | $76,500 | $174,900 |
| 2020 | $3,827 | $183,200 | $57,800 | $125,400 |
| 2019 | $3,827 | $183,200 | $57,800 | $125,400 |
| 2018 | $3,688 | $183,200 | $57,800 | $125,400 |
| 2017 | $3,822 | $168,200 | $44,700 | $123,500 |
| 2016 | $3,682 | $168,200 | $44,700 | $123,500 |
| 2015 | $3,682 | $168,200 | $44,700 | $123,500 |
| 2014 | $3,766 | $163,300 | $44,700 | $118,600 |
Source: Public Records
Map
Nearby Homes