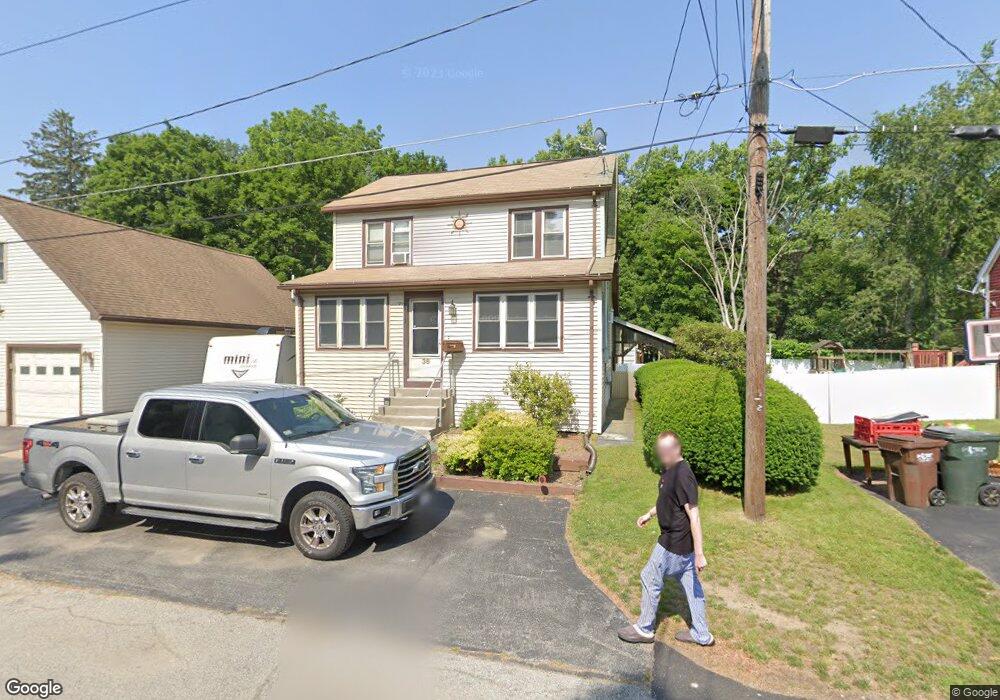
36 Franklin St Auburn, MA 01501
Stoneville NeighborhoodEstimated Value: $406,000 - $501,000
3
Beds
2
Baths
1,404
Sq Ft
$328/Sq Ft
Est. Value
About This Home
This home is located at 36 Franklin St, Auburn, MA 01501 and is currently estimated at $460,891, approximately $328 per square foot. 36 Franklin St is a home located in Worcester County with nearby schools including Auburn Senior High School and Shrewsbury Montessori School - Auburn Campus.
Ownership History
Date
Name
Owned For
Owner Type
Purchase Details
Closed on
May 5, 2004
Sold by
Gaboury Ellen and Gaboury Paul
Bought by
Gagne Kenneth W and Duncan Kimberly A
Current Estimated Value
Home Financials for this Owner
Home Financials are based on the most recent Mortgage that was taken out on this home.
Original Mortgage
$153,000
Outstanding Balance
$71,180
Interest Rate
5.39%
Mortgage Type
Purchase Money Mortgage
Estimated Equity
$389,711
Create a Home Valuation Report for This Property
The Home Valuation Report is an in-depth analysis detailing your home's value as well as a comparison with similar homes in the area
Home Values in the Area
Average Home Value in this Area
Purchase History
| Date | Buyer | Sale Price | Title Company |
|---|---|---|---|
| Gagne Kenneth W | $260,000 | -- |
Source: Public Records
Mortgage History
| Date | Status | Borrower | Loan Amount |
|---|---|---|---|
| Open | Gagne Kenneth W | $153,000 |
Source: Public Records
Tax History Compared to Growth
Tax History
| Year | Tax Paid | Tax Assessment Tax Assessment Total Assessment is a certain percentage of the fair market value that is determined by local assessors to be the total taxable value of land and additions on the property. | Land | Improvement |
|---|---|---|---|---|
| 2025 | $55 | $385,300 | $114,200 | $271,100 |
| 2024 | $5,160 | $345,600 | $108,500 | $237,100 |
| 2023 | $5,136 | $323,400 | $98,600 | $224,800 |
| 2022 | $4,873 | $289,700 | $98,600 | $191,100 |
| 2021 | $4,551 | $250,900 | $87,000 | $163,900 |
| 2020 | $4,355 | $242,200 | $87,000 | $155,200 |
| 2019 | $3,456 | $235,600 | $86,100 | $149,500 |
| 2018 | $4,145 | $224,800 | $80,500 | $144,300 |
| 2017 | $2,833 | $217,300 | $73,000 | $144,300 |
| 2016 | $3,750 | $207,300 | $76,700 | $130,600 |
| 2015 | $3,483 | $201,800 | $76,700 | $125,100 |
| 2014 | $3,422 | $197,900 | $73,100 | $124,800 |
Source: Public Records
Map
Nearby Homes