36 George St Attleboro, MA 02703
Estimated Value: $448,000 - $471,000
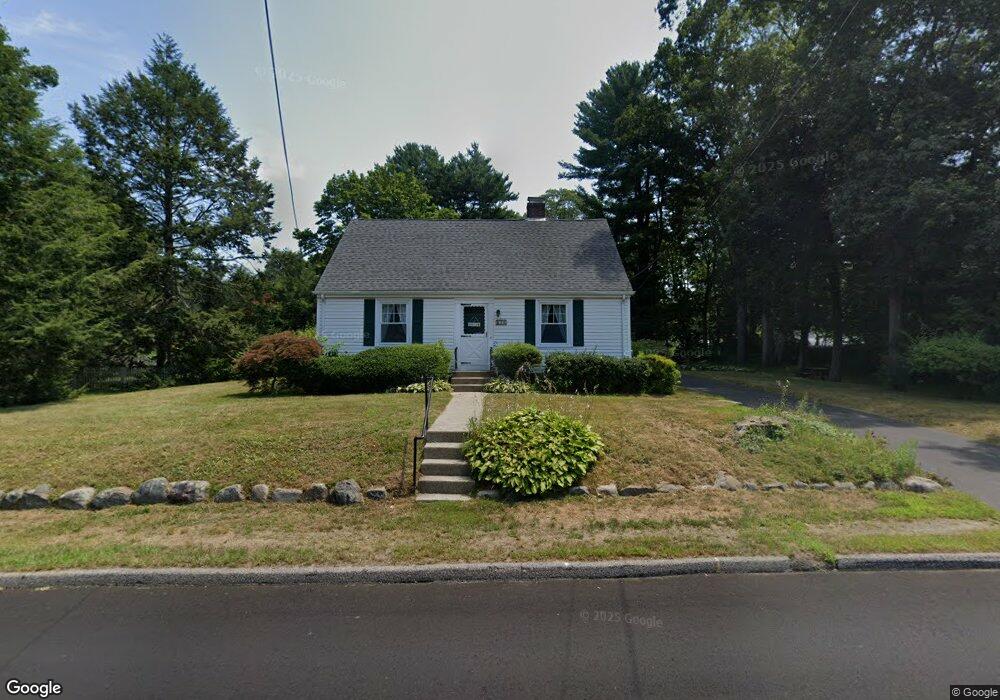
About This Home
This home is located at 36 George St, Attleboro, MA 02703 and is currently estimated at $462,346, approximately $337 per square foot. 36 George St is a home located in Bristol County with nearby schools including Hyman Fine Elementary School, Wamsutta Middle School, and Attleboro High School.
Ownership History
We collect this data history from publicly available records. To have your information removed, we recommend requesting removal directly through your county’s website.
Purchase Details
Home Values in the Area
Average Home Value in this Area
Purchase History
We collect this data history from publicly available records. To have your information removed, we recommend requesting removal directly through your county’s website.
| Date | Buyer | Sale Price | Title Company |
|---|---|---|---|
| -- | -- |
Mortgage History
We collect this data history from publicly available records. To have your information removed, we recommend requesting removal directly through your county’s website.
| Date | Status | Borrower | Loan Amount |
|---|---|---|---|
| Open | $40,000 | ||
| Closed | $21,067 | ||
| Closed | $26,550 | ||
| Closed | $25,000 |
Tax History
We collect this data history from publicly available records. To have your information removed, we recommend requesting removal directly through your county’s website.
| Year | Tax Paid | Tax Assessment Tax Assessment Total Assessment is a certain percentage of the fair market value that is determined by local assessors to be the total taxable value of land and additions on the property. | Land | Improvement |
|---|---|---|---|---|
| 2025 | $4,725 | $376,500 | $145,200 | $231,300 |
| 2024 | $4,607 | $361,900 | $145,200 | $216,700 |
| 2023 | $4,362 | $318,600 | $132,000 | $186,600 |
| 2022 | $4,176 | $289,000 | $125,800 | $163,200 |
| 2021 | $4,054 | $273,900 | $121,000 | $152,900 |
| 2020 | $3,880 | $266,500 | $117,400 | $149,100 |
| 2019 | $3,669 | $259,100 | $115,200 | $143,900 |
| 2018 | $3,533 | $238,400 | $111,800 | $126,600 |
| 2017 | $3,432 | $235,900 | $111,800 | $124,100 |
| 2016 | $3,355 | $226,400 | $109,600 | $116,800 |
| 2015 | $3,205 | $217,900 | $109,600 | $108,300 |
| 2014 | $3,129 | $210,700 | $104,400 | $106,300 |
Map
- 109 Maple St Unit A6
- 35 Hazel St Unit B
- 66 Holman St
- 7 Howard Ave
- 40 Falmouth St
- 178 S Main St
- 180 S Main St Unit 20
- 180 S Main St Unit 12
- 100 S Main St
- 222-226 S St
- 40 Park St Unit 4
- 10-12 Olive St
- 145 Pleasant St
- 49 Steeple Chase Cir Unit 2
- 2 Hope St
- 0 Rosedale Ln Unit 73469293
- 13 Oakdale St
- 0 Oak St
- 30 Hope St
- 43 Marjorie St
Ask me questions while you tour the home.