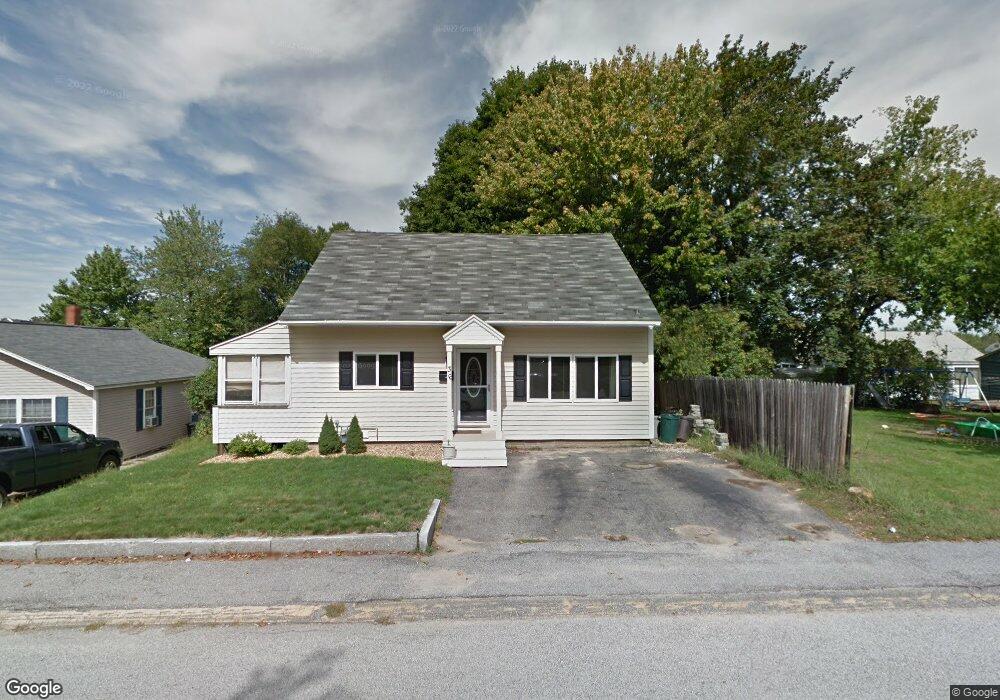
36 Granite St Allenstown, NH 03275
Suncook NeighborhoodEstimated Value: $369,000 - $416,734
3
Beds
2
Baths
1,674
Sq Ft
$237/Sq Ft
Est. Value
About This Home
This home is located at 36 Granite St, Allenstown, NH 03275 and is currently estimated at $395,934, approximately $236 per square foot. 36 Granite St is a home located in Merrimack County with nearby schools including Allenstown Elementary School, Armand R. Dupont School, and Tender Years Child Care & Learning Center.
Ownership History
Date
Name
Owned For
Owner Type
Purchase Details
Closed on
Sep 11, 2006
Sold by
Gardner Steven B and Gardner Patricia L
Bought by
Lapointe Stephen A and Lapointe Sarah L
Current Estimated Value
Home Financials for this Owner
Home Financials are based on the most recent Mortgage that was taken out on this home.
Original Mortgage
$196,402
Interest Rate
6.79%
Purchase Details
Closed on
Nov 2, 1998
Sold by
Gagne Glenn R
Bought by
Gardner Steven B and Gardner Patricia L
Home Financials for this Owner
Home Financials are based on the most recent Mortgage that was taken out on this home.
Original Mortgage
$80,800
Interest Rate
6.68%
Create a Home Valuation Report for This Property
The Home Valuation Report is an in-depth analysis detailing your home's value as well as a comparison with similar homes in the area
Home Values in the Area
Average Home Value in this Area
Purchase History
| Date | Buyer | Sale Price | Title Company |
|---|---|---|---|
| Lapointe Stephen A | $198,000 | -- | |
| Lapointe Stephen A | $198,000 | -- | |
| Gardner Steven B | $81,000 | -- |
Source: Public Records
Mortgage History
| Date | Status | Borrower | Loan Amount |
|---|---|---|---|
| Open | Gardner Steven B | $194,769 | |
| Closed | Gardner Steven B | $198,598 | |
| Closed | Lapointe Stephen A | $196,402 | |
| Previous Owner | Gardner Steven B | $80,800 |
Source: Public Records
Tax History Compared to Growth
Tax History
| Year | Tax Paid | Tax Assessment Tax Assessment Total Assessment is a certain percentage of the fair market value that is determined by local assessors to be the total taxable value of land and additions on the property. | Land | Improvement |
|---|---|---|---|---|
| 2024 | $8,094 | $318,400 | $142,200 | $176,200 |
| 2023 | $6,750 | $318,400 | $142,200 | $176,200 |
| 2022 | $6,209 | $318,400 | $142,200 | $176,200 |
| 2021 | $5,783 | $183,600 | $78,700 | $104,900 |
| 2020 | $5,379 | $183,600 | $78,700 | $104,900 |
| 2019 | $5,713 | $183,700 | $78,700 | $105,000 |
| 2018 | $5,539 | $183,700 | $78,700 | $105,000 |
| 2017 | $5,899 | $183,700 | $78,700 | $105,000 |
| 2016 | $4,988 | $147,300 | $49,600 | $97,700 |
| 2015 | $4,836 | $147,300 | $49,600 | $97,700 |
| 2014 | $4,976 | $147,300 | $49,600 | $97,700 |
| 2013 | $4,644 | $147,300 | $49,600 | $97,700 |
Source: Public Records
Map
Nearby Homes
- 422 Dawn Dr Unit 23
- 427 Dawn Dr Unit 15
- 11 Letendre Ave
- 15 Main St
- 7 Ferry St
- 111 Glass St
- 100 Main St Unit 312
- 100 Main St Unit M7
- 1 1/2 Bartlett St
- 163-165 Main St
- 1 Lane Dr
- 10 Lane Dr
- 8 Sky View Terrace
- 2 Cheryl Dr
- 6 Meadow Ln
- 224 Pembroke St
- 26 Roland Dr
- 15 Sullivan Dr
- 230 Liberty Dr Unit B
- 233 Pembroke St