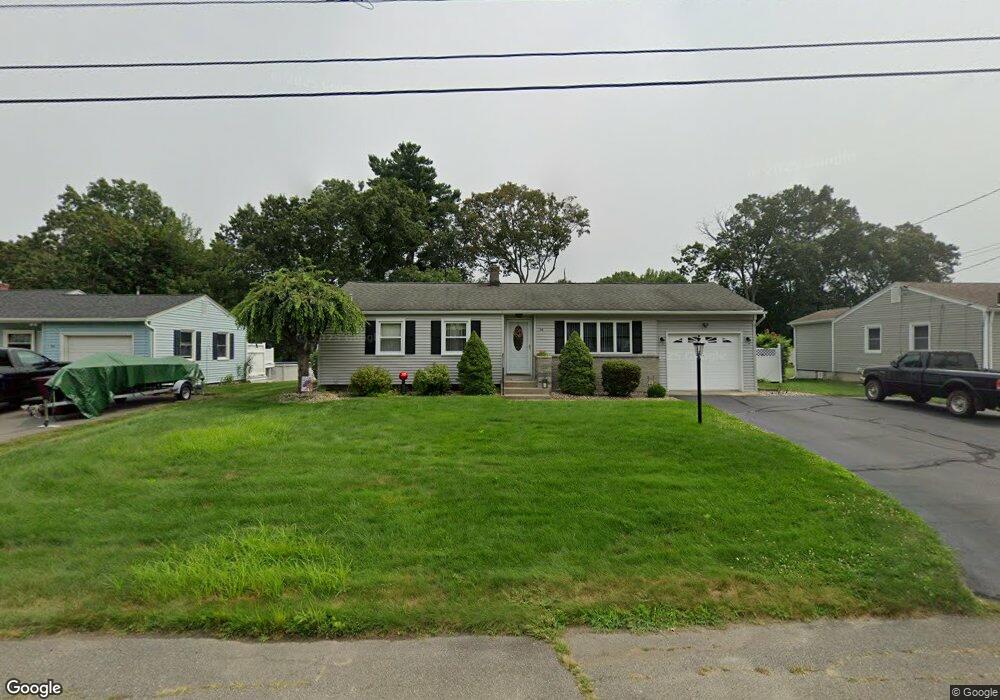
36 Haswell Cir Ludlow, MA 01056
Estimated Value: $305,000 - $354,000
3
Beds
1
Bath
1,298
Sq Ft
$253/Sq Ft
Est. Value
About This Home
This home is located at 36 Haswell Cir, Ludlow, MA 01056 and is currently estimated at $328,847, approximately $253 per square foot. 36 Haswell Cir is a home located in Hampden County with nearby schools including East Street Elementary School, Chapin Street Elementary School, and Paul R. Baird Middle School.
Ownership History
Date
Name
Owned For
Owner Type
Purchase Details
Closed on
Jun 11, 2024
Sold by
Castor Doreen and Crespo Darcey
Bought by
Connaughton Barbara J
Current Estimated Value
Purchase Details
Closed on
Nov 28, 2023
Sold by
Connaughton Barbara J
Bought by
Castor Doreen and Crespo Darcey
Create a Home Valuation Report for This Property
The Home Valuation Report is an in-depth analysis detailing your home's value as well as a comparison with similar homes in the area
Home Values in the Area
Average Home Value in this Area
Purchase History
| Date | Buyer | Sale Price | Title Company |
|---|---|---|---|
| Connaughton Barbara J | -- | None Available | |
| Connaughton Barbara J | -- | None Available | |
| Connaughton Barbara J | -- | None Available | |
| Castor Doreen | -- | None Available | |
| Castor Doreen | -- | None Available | |
| Castor Doreen | -- | None Available |
Source: Public Records
Tax History
| Year | Tax Paid | Tax Assessment Tax Assessment Total Assessment is a certain percentage of the fair market value that is determined by local assessors to be the total taxable value of land and additions on the property. | Land | Improvement |
|---|---|---|---|---|
| 2025 | $5,153 | $297,000 | $102,000 | $195,000 |
| 2024 | $4,968 | $274,600 | $102,000 | $172,600 |
| 2023 | $4,774 | $244,700 | $93,400 | $151,300 |
| 2022 | $4,290 | $214,600 | $85,700 | $128,900 |
| 2021 | $4,364 | $207,000 | $85,700 | $121,300 |
| 2020 | $4,223 | $204,800 | $84,300 | $120,500 |
| 2019 | $3,984 | $201,000 | $83,500 | $117,500 |
| 2018 | $3,773 | $198,500 | $83,500 | $115,000 |
| 2017 | $3,691 | $199,200 | $81,900 | $117,300 |
| 2016 | $3,508 | $193,500 | $80,200 | $113,300 |
| 2015 | $3,321 | $192,100 | $79,400 | $112,700 |
Source: Public Records
Map
Nearby Homes
- 382 Holyoke St
- 47 Kendall St
- Lot 602 Grandview Ave
- 482 Holyoke St
- 350 West St Unit 3
- 350 West St Unit 19
- 350 West St Unit 17
- 119 Blisswood Village Dr
- 57 Belmont St
- 98 Fuller St Unit 32
- 102 Swan Ave
- 420 West St
- 70 Fuller St
- 26 Swan Ave
- 0 Fuller St Unit 73409741
- 15 Hilltop Terrace
- 84 Chapin Greene Dr
- 42 Roy St
- 350 West Ave Unit 5
- '0' Rood St
Your Personal Tour Guide
Ask me questions while you tour the home.