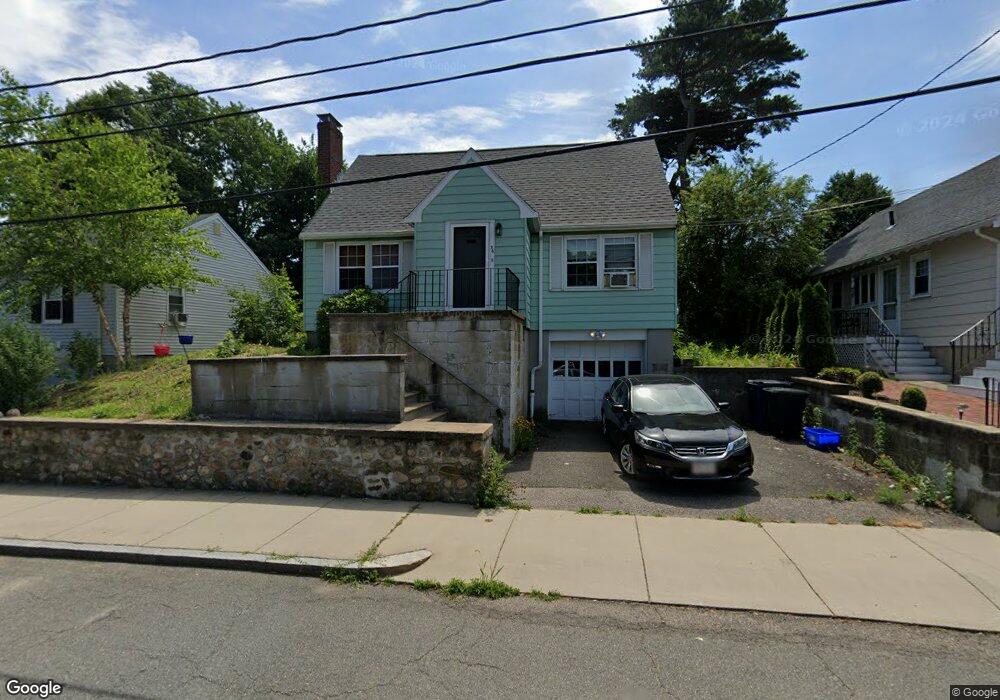
36 Hemlock Rd West Roxbury, MA 02132
Upper Washington-Spring Street NeighborhoodEstimated Value: $686,111 - $754,000
3
Beds
2
Baths
1,498
Sq Ft
$482/Sq Ft
Est. Value
About This Home
This home is located at 36 Hemlock Rd, West Roxbury, MA 02132 and is currently estimated at $722,028, approximately $481 per square foot. 36 Hemlock Rd is a home located in Suffolk County with nearby schools including St Theresa School, Catholic Memorial School, and The Roxbury Latin School.
Ownership History
Date
Name
Owned For
Owner Type
Purchase Details
Closed on
Jun 19, 2003
Sold by
Mattimoe Donna J
Bought by
Salhaney Phil
Current Estimated Value
Home Financials for this Owner
Home Financials are based on the most recent Mortgage that was taken out on this home.
Original Mortgage
$252,500
Outstanding Balance
$109,102
Interest Rate
5.71%
Mortgage Type
Purchase Money Mortgage
Estimated Equity
$612,926
Purchase Details
Closed on
Aug 31, 1993
Sold by
Nolan Joan R
Bought by
Sullivan Francis A and Sullivan Kathleen
Create a Home Valuation Report for This Property
The Home Valuation Report is an in-depth analysis detailing your home's value as well as a comparison with similar homes in the area
Home Values in the Area
Average Home Value in this Area
Purchase History
| Date | Buyer | Sale Price | Title Company |
|---|---|---|---|
| Salhaney Phil | $316,000 | -- | |
| Sullivan Francis A | $137,000 | -- |
Source: Public Records
Mortgage History
| Date | Status | Borrower | Loan Amount |
|---|---|---|---|
| Open | Salhaney Phil | $252,500 |
Source: Public Records
Tax History Compared to Growth
Tax History
| Year | Tax Paid | Tax Assessment Tax Assessment Total Assessment is a certain percentage of the fair market value that is determined by local assessors to be the total taxable value of land and additions on the property. | Land | Improvement |
|---|---|---|---|---|
| 2025 | $6,282 | $542,500 | $180,600 | $361,900 |
| 2024 | $5,935 | $544,500 | $192,900 | $351,600 |
| 2023 | $5,848 | $544,500 | $192,900 | $351,600 |
| 2022 | $5,386 | $495,000 | $175,400 | $319,600 |
| 2021 | $4,907 | $459,900 | $167,100 | $292,800 |
| 2020 | $4,598 | $435,400 | $146,800 | $288,600 |
| 2019 | $4,331 | $410,900 | $119,700 | $291,200 |
| 2018 | $3,986 | $380,300 | $119,700 | $260,600 |
| 2017 | $3,986 | $376,400 | $119,700 | $256,700 |
| 2016 | $3,906 | $355,100 | $119,700 | $235,400 |
| 2015 | $3,771 | $311,400 | $131,300 | $180,100 |
| 2014 | $3,662 | $291,100 | $131,300 | $159,800 |
Source: Public Records
Map
Nearby Homes
- 80 Caledonian Ave
- 1515 Vfw Pkwy Unit M19
- 63 Johnson St
- 46 Bayard St
- 7 Cass St Unit 6
- 12 Bronx Rd
- 14 Arbor Ln
- 2231 Centre St
- 110 New Haven St
- 1216 Vfw Pkwy Unit 40
- 1214 Vfw Pkwy Unit 30
- 1214 Vfw Pkwy Unit 37
- 191 Glenellen Rd
- 55 Cottage Rd
- 199 Glenellen Rd
- 340 Baker St Unit 1
- 14 Sanborn Ave
- 115 Grove St Unit 11
- 111 Grove St Unit 6
- 27-29 Temple St