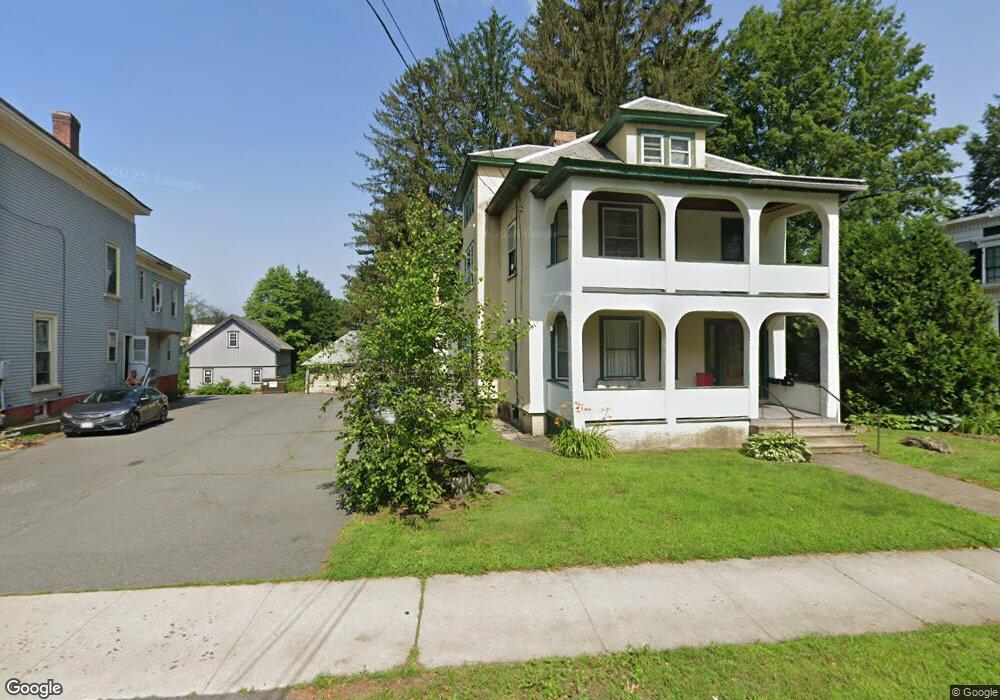
36 High St Unit 38 Greenfield, MA 01301
Estimated Value: $623,012
5
Beds
4
Baths
4,225
Sq Ft
$147/Sq Ft
Est. Value
About This Home
This home is located at 36 High St Unit 38, Greenfield, MA 01301 and is currently estimated at $623,012, approximately $147 per square foot. 36 High St Unit 38 is a home located in Franklin County with nearby schools including Holy Trinity School and Cornerstone Christian School.
Ownership History
Date
Name
Owned For
Owner Type
Purchase Details
Closed on
Nov 25, 2003
Sold by
Levinson Arnold G
Bought by
Landry Crystal E and Provost Stuart R
Current Estimated Value
Home Financials for this Owner
Home Financials are based on the most recent Mortgage that was taken out on this home.
Original Mortgage
$196,000
Outstanding Balance
$91,457
Interest Rate
5.98%
Mortgage Type
Commercial
Estimated Equity
$531,555
Purchase Details
Closed on
Jul 25, 2003
Sold by
Pearl Acquisitions Llc
Bought by
Levinson Arnold G
Create a Home Valuation Report for This Property
The Home Valuation Report is an in-depth analysis detailing your home's value as well as a comparison with similar homes in the area
Home Values in the Area
Average Home Value in this Area
Purchase History
| Date | Buyer | Sale Price | Title Company |
|---|---|---|---|
| Landry Crystal E | $245,000 | -- | |
| Landry Crystal E | $245,000 | -- | |
| Levinson Arnold G | -- | -- |
Source: Public Records
Mortgage History
| Date | Status | Borrower | Loan Amount |
|---|---|---|---|
| Open | Levinson Arnold G | $196,000 | |
| Closed | Levinson Arnold G | $196,000 |
Source: Public Records
Tax History Compared to Growth
Tax History
| Year | Tax Paid | Tax Assessment Tax Assessment Total Assessment is a certain percentage of the fair market value that is determined by local assessors to be the total taxable value of land and additions on the property. | Land | Improvement |
|---|---|---|---|---|
| 2025 | $7,617 | $389,400 | $72,300 | $317,100 |
| 2024 | $8,902 | $436,600 | $59,500 | $377,100 |
| 2023 | $8,776 | $431,600 | $59,500 | $372,100 |
| 2022 | $8,292 | $371,500 | $56,700 | $314,800 |
| 2021 | $7,872 | $339,000 | $56,700 | $282,300 |
| 2020 | $7,773 | $339,000 | $56,700 | $282,300 |
| 2019 | $7,415 | $331,600 | $49,300 | $282,300 |
| 2018 | $7,281 | $324,600 | $48,200 | $276,400 |
| 2017 | $7,054 | $324,600 | $48,200 | $276,400 |
| 2016 | $7,389 | $338,800 | $51,000 | $287,800 |
| 2015 | $7,124 | $316,500 | $51,000 | $265,500 |
| 2014 | $6,752 | $328,900 | $51,000 | $277,900 |
Source: Public Records
Map
Nearby Homes