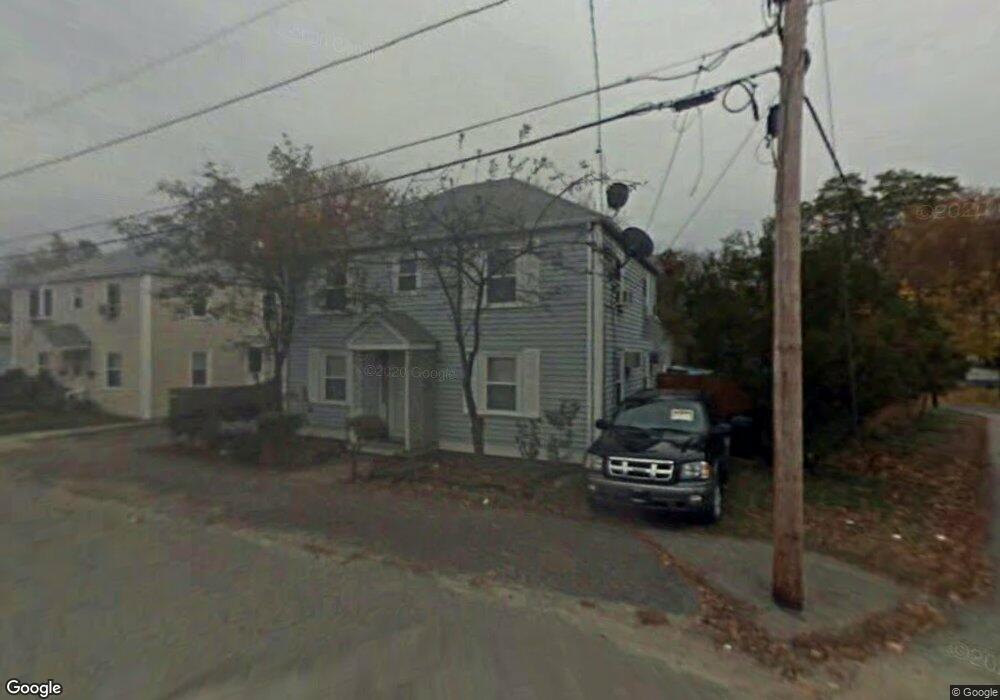
36 Hobson Ave Cranston, RI 02910
Spectacle NeighborhoodEstimated Value: $427,967 - $448,000
4
Beds
2
Baths
1,440
Sq Ft
$302/Sq Ft
Est. Value
About This Home
This home is located at 36 Hobson Ave, Cranston, RI 02910 and is currently estimated at $435,242, approximately $302 per square foot. 36 Hobson Ave is a home located in Providence County with nearby schools including Stadium Elementary School, Hugh B. Bain Middle School, and Cranston High School East.
Ownership History
Date
Name
Owned For
Owner Type
Purchase Details
Closed on
Apr 3, 1998
Sold by
Champagne Robert E and Champagne Carol
Bought by
Ovsepain Serezha
Current Estimated Value
Create a Home Valuation Report for This Property
The Home Valuation Report is an in-depth analysis detailing your home's value as well as a comparison with similar homes in the area
Home Values in the Area
Average Home Value in this Area
Purchase History
| Date | Buyer | Sale Price | Title Company |
|---|---|---|---|
| Ovsepain Serezha | $88,000 | -- |
Source: Public Records
Mortgage History
| Date | Status | Borrower | Loan Amount |
|---|---|---|---|
| Open | Ovsepain Serezha | $30,000 | |
| Closed | Ovsepain Serezha | $21,874 | |
| Open | Ovsepain Serezha | $200,000 | |
| Closed | Ovsepain Serezha | $10,300 |
Source: Public Records
Tax History
| Year | Tax Paid | Tax Assessment Tax Assessment Total Assessment is a certain percentage of the fair market value that is determined by local assessors to be the total taxable value of land and additions on the property. | Land | Improvement |
|---|---|---|---|---|
| 2025 | $4,800 | $345,800 | $104,400 | $241,400 |
| 2024 | $4,706 | $345,800 | $104,400 | $241,400 |
| 2023 | $4,581 | $242,400 | $72,000 | $170,400 |
| 2022 | $4,487 | $242,400 | $72,000 | $170,400 |
| 2021 | $4,363 | $242,400 | $72,000 | $170,400 |
| 2020 | $4,235 | $203,900 | $68,400 | $135,500 |
| 2019 | $4,235 | $203,900 | $68,400 | $135,500 |
| 2018 | $4,137 | $203,900 | $68,400 | $135,500 |
| 2017 | $3,758 | $163,800 | $50,400 | $113,400 |
| 2016 | $3,677 | $163,800 | $50,400 | $113,400 |
| 2015 | $3,677 | $163,800 | $50,400 | $113,400 |
| 2014 | $3,769 | $165,000 | $50,400 | $114,600 |
Source: Public Records
Map
Nearby Homes
- 30 Hobson Ave
- 215 Eldridge St
- 231 Eldridge St
- 26 Hobson Ave
- 209 Eldridge St
- 31 Hobson Ave
- 222 Eldridge St Unit 1L
- 222 Eldridge St
- 222 Eldridge St Unit 2R
- 237 Eldridge St
- 214 Eldridge St
- 25 Hobson Ave
- 226 Eldridge St
- 210 Eldridge St
- 21 Hobson Ave
- 135 Frankfort St
- 234 Eldridge St
- 104 Speck Ave
- 98 Speck Ave
- 201 Eldridge St
Your Personal Tour Guide
Ask me questions while you tour the home.