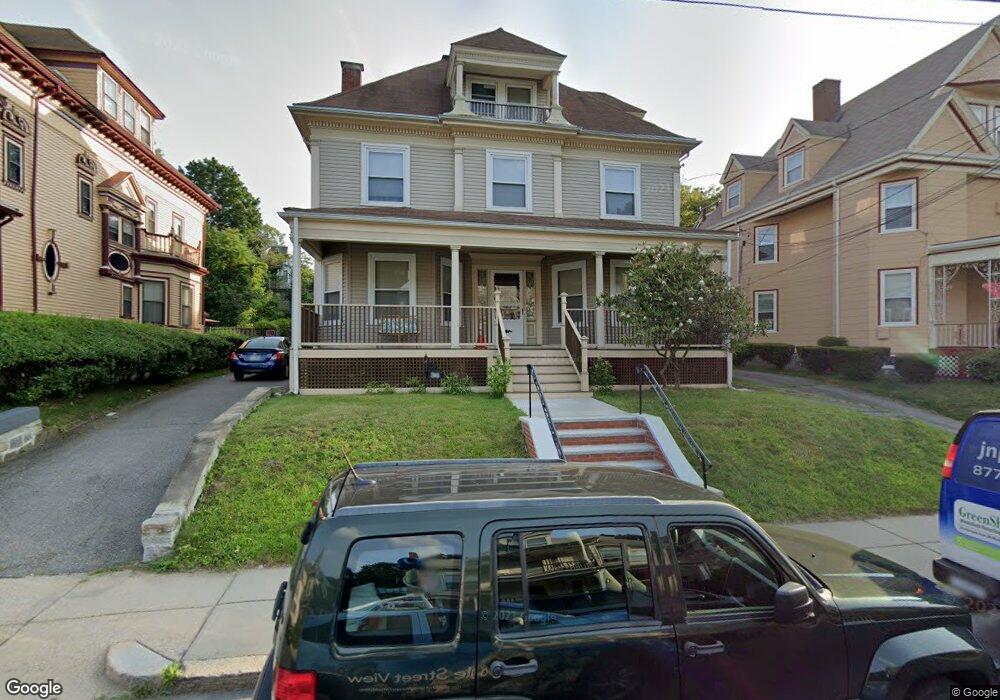
36 Howland St Dorchester, MA 02121
Washington Park NeighborhoodEstimated Value: $723,000 - $928,000
8
Beds
3
Baths
3,687
Sq Ft
$228/Sq Ft
Est. Value
About This Home
This home is located at 36 Howland St, Dorchester, MA 02121 and is currently estimated at $839,632, approximately $227 per square foot. 36 Howland St is a home located in Suffolk County with nearby schools including Bridge Boston Charter School and Mother Caroline Academy & Education Center.
Ownership History
Date
Name
Owned For
Owner Type
Purchase Details
Closed on
May 23, 2005
Sold by
Johnson Glinda and Johnson Ronald
Bought by
Johnson Glinda and Johnson Ronald
Current Estimated Value
Purchase Details
Closed on
Jul 3, 1991
Sold by
Growth Mtg Co Inc
Bought by
Johnson-Aaron Glinda and Johnson Ronald
Purchase Details
Closed on
May 3, 1990
Sold by
Nathan Natalie
Bought by
Growth Mtg Co Inc
Create a Home Valuation Report for This Property
The Home Valuation Report is an in-depth analysis detailing your home's value as well as a comparison with similar homes in the area
Home Values in the Area
Average Home Value in this Area
Purchase History
| Date | Buyer | Sale Price | Title Company |
|---|---|---|---|
| Johnson Glinda | -- | -- | |
| Johnson-Aaron Glinda | $135,000 | -- | |
| Growth Mtg Co Inc | $135,000 | -- |
Source: Public Records
Mortgage History
| Date | Status | Borrower | Loan Amount |
|---|---|---|---|
| Previous Owner | Growth Mtg Co Inc | $274,000 | |
| Previous Owner | Growth Mtg Co Inc | $29,034 |
Source: Public Records
Tax History Compared to Growth
Tax History
| Year | Tax Paid | Tax Assessment Tax Assessment Total Assessment is a certain percentage of the fair market value that is determined by local assessors to be the total taxable value of land and additions on the property. | Land | Improvement |
|---|---|---|---|---|
| 2025 | $8,864 | $765,500 | $199,300 | $566,200 |
| 2024 | $7,086 | $650,100 | $199,400 | $450,700 |
| 2023 | $6,982 | $650,100 | $199,400 | $450,700 |
| 2022 | $6,613 | $607,800 | $186,500 | $421,300 |
| 2021 | $6,183 | $579,500 | $182,800 | $396,700 |
| 2020 | $4,979 | $471,500 | $167,300 | $304,200 |
| 2019 | $4,644 | $440,600 | $139,100 | $301,500 |
| 2018 | $4,314 | $411,600 | $139,100 | $272,500 |
| 2017 | $4,359 | $411,600 | $139,100 | $272,500 |
| 2016 | $4,356 | $396,000 | $139,100 | $256,900 |
| 2015 | $3,583 | $295,900 | $88,000 | $207,900 |
| 2014 | $3,614 | $287,300 | $88,000 | $199,300 |
Source: Public Records
Map
Nearby Homes
- 164 Ruthven St Unit 1
- 28 Wabon St
- 7 Waumbeck St Unit 3
- 4 Wyoming St Unit 2
- 214 Humboldt Ave
- 495 Warren St
- 476 Warren St
- 75 Ruthven St
- 78 Hutchings St Unit 1
- 5 Glenburne St
- 2 Otisfield St
- 99 Harrishof St
- 32 Hartwell St
- 8 Weldon St
- 12 Weldon St
- 9 Abbotsford St Unit 1
- 151 Townsend St
- 40 Devon St Unit 3
- 352 Blue Hill Ave Unit 8
- 340 Blue Hill Ave
- 34 Howland St
- 34 Howland St Unit 2
- 38 Howland St
- 32 Howland St Unit 32A
- 32 Howland St Unit 2
- 40 Howland St
- 40 Howland St Unit 2
- 53 Crawford St
- 37 Howland St
- 37 Howland St Unit 2
- 49 Crawford St
- 57 Crawford St
- 39 Howland St
- 39 Howland St Unit 1
- 39 Howland St Unit 2
- 55 Crawford St Unit 55A
- 55 Crawford St
- 55 Crawford St Unit 2
- 30 Howland St
- 30 Howaland Unit 2