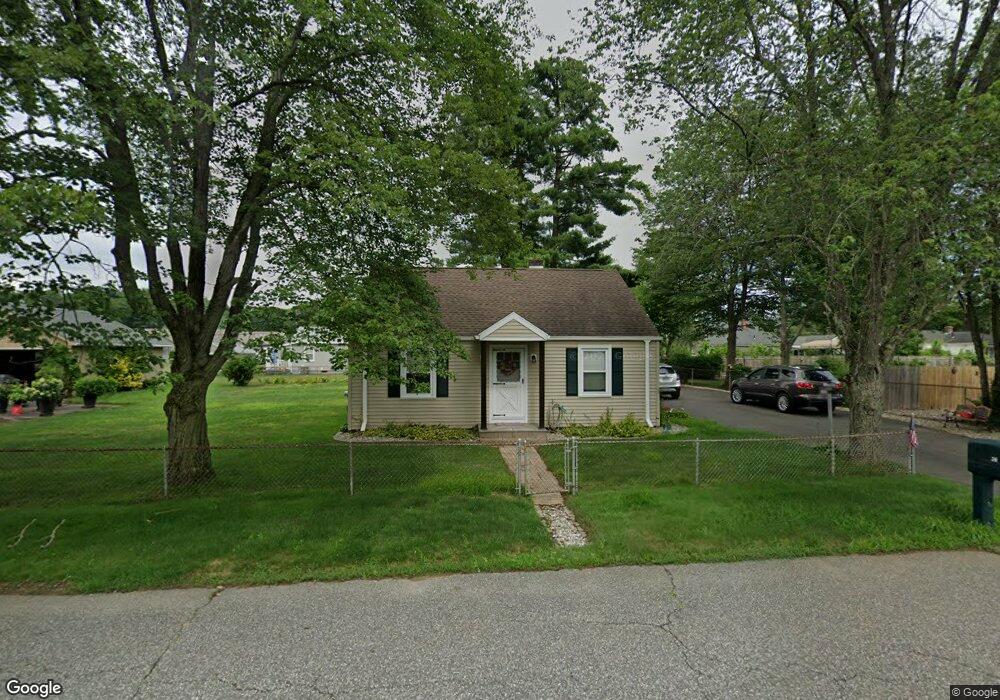
36 John St Ludlow, MA 01056
Estimated Value: $304,000 - $327,000
3
Beds
1
Bath
1,170
Sq Ft
$270/Sq Ft
Est. Value
About This Home
This home is located at 36 John St, Ludlow, MA 01056 and is currently estimated at $316,266, approximately $270 per square foot. 36 John St is a home located in Hampden County with nearby schools including East Street Elementary School, Chapin Street Elementary School, and Paul R. Baird Middle School.
Ownership History
Date
Name
Owned For
Owner Type
Purchase Details
Closed on
Jun 30, 1999
Sold by
Currier James A and Currier Martha A
Bought by
Fournier James A and Fournier Tami F
Current Estimated Value
Home Financials for this Owner
Home Financials are based on the most recent Mortgage that was taken out on this home.
Original Mortgage
$95,880
Outstanding Balance
$26,073
Interest Rate
7.19%
Mortgage Type
Purchase Money Mortgage
Estimated Equity
$290,193
Create a Home Valuation Report for This Property
The Home Valuation Report is an in-depth analysis detailing your home's value as well as a comparison with similar homes in the area
Home Values in the Area
Average Home Value in this Area
Purchase History
| Date | Buyer | Sale Price | Title Company |
|---|---|---|---|
| Fournier James A | $94,000 | -- | |
| Fournier James A | $94,000 | -- |
Source: Public Records
Mortgage History
| Date | Status | Borrower | Loan Amount |
|---|---|---|---|
| Open | Fournier James A | $95,880 | |
| Closed | Fournier James A | $95,880 | |
| Previous Owner | Fournier James A | $37,700 | |
| Previous Owner | Fournier James A | $28,000 |
Source: Public Records
Tax History
| Year | Tax Paid | Tax Assessment Tax Assessment Total Assessment is a certain percentage of the fair market value that is determined by local assessors to be the total taxable value of land and additions on the property. | Land | Improvement |
|---|---|---|---|---|
| 2025 | $4,239 | $244,300 | $81,400 | $162,900 |
| 2024 | $4,137 | $228,700 | $81,400 | $147,300 |
| 2023 | $3,879 | $198,800 | $71,400 | $127,400 |
| 2022 | $3,726 | $186,400 | $71,400 | $115,000 |
| 2021 | $3,759 | $178,300 | $71,400 | $106,900 |
| 2020 | $3,600 | $174,600 | $70,300 | $104,300 |
| 2019 | $3,358 | $169,400 | $69,700 | $99,700 |
| 2018 | $3,158 | $166,100 | $69,700 | $96,400 |
| 2017 | $2,998 | $161,800 | $68,300 | $93,500 |
| 2016 | $2,848 | $157,100 | $66,900 | $90,200 |
| 2015 | $2,671 | $154,500 | $66,200 | $88,300 |
Source: Public Records
Map
Nearby Homes
- 84 Chapin Greene Dr
- 102 Swan Ave
- 42 Loopley St
- 26 Swan Ave
- 119 Blisswood Village Dr
- 70 Sroka Ln
- 70 Fuller St
- 665 Center St Unit 706
- '0' Rood St
- 0 Fuller St Unit 73409741
- 382 Holyoke St
- 57 Belmont St
- 50 Warsaw Ave
- 47 Kendall St
- Lot 602 Grandview Ave
- 31 Greenwich St
- 59 Prospect St
- 287 East St
- 0 Center St Unit 73415933
- 45 Canterbury St
Your Personal Tour Guide
Ask me questions while you tour the home.