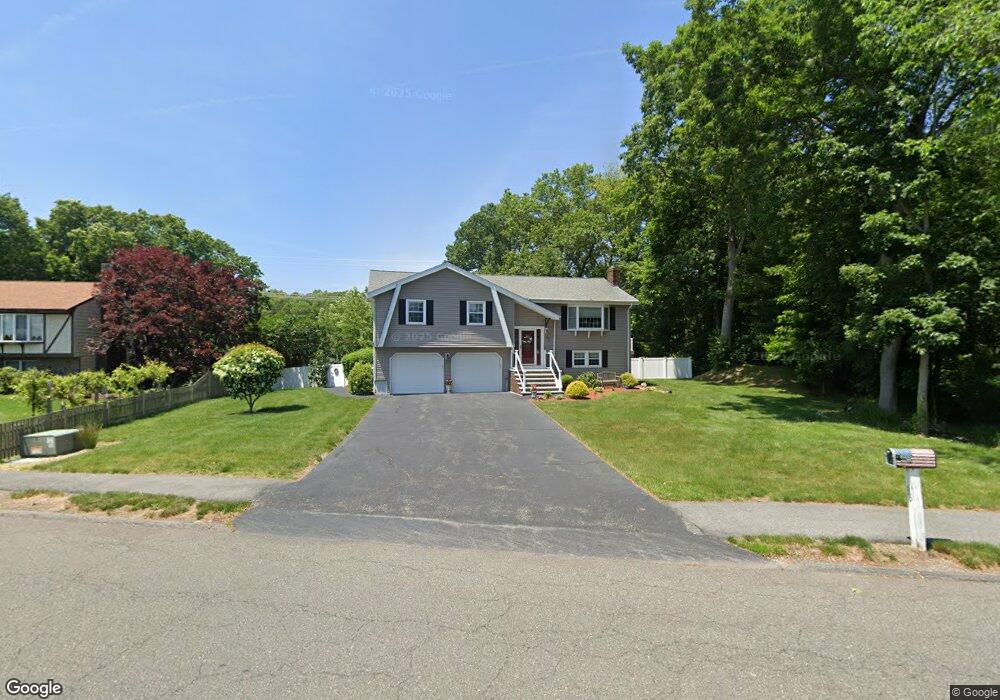
36 Juniper Dr Saugus, MA 01906
Oakland Vale NeighborhoodEstimated Value: $903,000 - $975,000
3
Beds
3
Baths
2,198
Sq Ft
$422/Sq Ft
Est. Value
About This Home
This home is located at 36 Juniper Dr, Saugus, MA 01906 and is currently estimated at $927,066, approximately $421 per square foot. 36 Juniper Dr is a home located in Essex County with nearby schools including Saugus High School, Pioneer Charter School Of Science II, and Melrose Montessori School.
Ownership History
Date
Name
Owned For
Owner Type
Purchase Details
Closed on
Dec 5, 2019
Sold by
Noel Monica and Noel William S
Bought by
Noel Monica
Current Estimated Value
Purchase Details
Closed on
Jan 29, 2007
Sold by
Turco Martin A
Bought by
Noel William S and Noel Monica
Home Financials for this Owner
Home Financials are based on the most recent Mortgage that was taken out on this home.
Original Mortgage
$150,000
Interest Rate
6.15%
Mortgage Type
Purchase Money Mortgage
Create a Home Valuation Report for This Property
The Home Valuation Report is an in-depth analysis detailing your home's value as well as a comparison with similar homes in the area
Home Values in the Area
Average Home Value in this Area
Purchase History
| Date | Buyer | Sale Price | Title Company |
|---|---|---|---|
| Noel Monica | -- | None Available | |
| Noel William S | $500,000 | -- |
Source: Public Records
Mortgage History
| Date | Status | Borrower | Loan Amount |
|---|---|---|---|
| Previous Owner | Noel William S | $145,000 | |
| Previous Owner | Noel William S | $35,000 | |
| Previous Owner | Noel William S | $150,000 |
Source: Public Records
Tax History
| Year | Tax Paid | Tax Assessment Tax Assessment Total Assessment is a certain percentage of the fair market value that is determined by local assessors to be the total taxable value of land and additions on the property. | Land | Improvement |
|---|---|---|---|---|
| 2025 | $8,023 | $751,200 | $395,100 | $356,100 |
| 2024 | $7,736 | $726,400 | $380,100 | $346,300 |
| 2023 | $7,581 | $673,300 | $345,100 | $328,200 |
| 2022 | $7,309 | $608,600 | $314,100 | $294,500 |
| 2021 | $7,004 | $567,600 | $273,100 | $294,500 |
| 2020 | $6,582 | $552,200 | $273,100 | $279,100 |
| 2019 | $6,403 | $525,700 | $260,100 | $265,600 |
| 2018 | $5,804 | $501,200 | $247,100 | $254,100 |
| 2017 | $5,565 | $461,800 | $235,100 | $226,700 |
| 2016 | $5,125 | $420,100 | $224,900 | $195,200 |
| 2015 | $4,808 | $400,000 | $214,100 | $185,900 |
| 2014 | $4,476 | $385,500 | $214,100 | $171,400 |
Source: Public Records
Map
Nearby Homes
- 24 Juniper Dr
- 12 Heritage Ln
- 62 Golden Hills Rd
- 24 Mount Zion Rd
- 176 Bay State Rd
- 768 Lynn Fells Pkwy
- 7 West St
- 98 Boardman Ave
- 7 Blacksmith Way
- 148 Forest St
- 5 Thomas St Unit 8
- 70 Ardsmoor Rd
- 38 Morgan Ave
- 921 Sherwood Forest Ln
- 180 Green St Unit 101
- 34-36 W Highland Ave
- 801 Sherwood Forest Ln
- 58 Franklin St Unit 58
- 60 Franklin St Unit 60
- 112 Porter St Unit 3
Your Personal Tour Guide
Ask me questions while you tour the home.