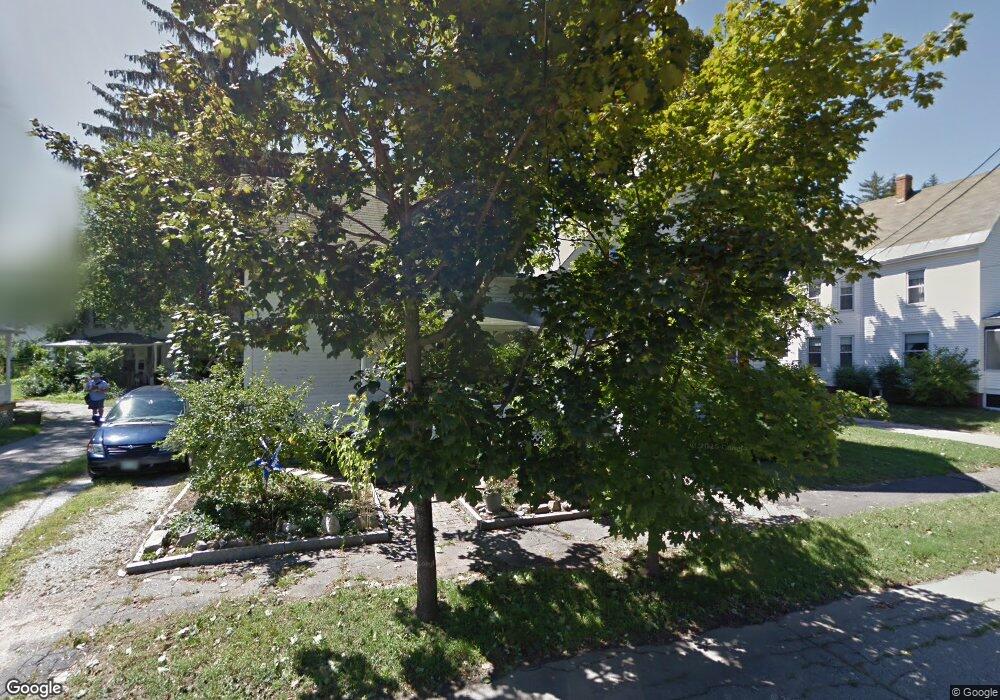
36 Kimball St Concord, NH 03301
South End NeighborhoodEstimated Value: $465,677 - $506,000
4
Beds
2
Baths
1,517
Sq Ft
$319/Sq Ft
Est. Value
About This Home
This home is located at 36 Kimball St, Concord, NH 03301 and is currently estimated at $483,169, approximately $318 per square foot. 36 Kimball St is a home located in Merrimack County with nearby schools including Abbot-Downing School, Rundlett Middle School, and Concord High School.
Ownership History
Date
Name
Owned For
Owner Type
Purchase Details
Closed on
Oct 16, 2006
Sold by
Burt Elizabeth M
Bought by
Hemenway Levin P
Current Estimated Value
Home Financials for this Owner
Home Financials are based on the most recent Mortgage that was taken out on this home.
Original Mortgage
$204,000
Outstanding Balance
$58,197
Interest Rate
6%
Mortgage Type
Adjustable Rate Mortgage/ARM
Estimated Equity
$424,972
Purchase Details
Closed on
May 30, 2003
Sold by
Winston Thomas F and Winston Jeanne T
Bought by
Burt Elizabeth M
Home Financials for this Owner
Home Financials are based on the most recent Mortgage that was taken out on this home.
Original Mortgage
$154,400
Interest Rate
5.86%
Mortgage Type
Purchase Money Mortgage
Create a Home Valuation Report for This Property
The Home Valuation Report is an in-depth analysis detailing your home's value as well as a comparison with similar homes in the area
Home Values in the Area
Average Home Value in this Area
Purchase History
| Date | Buyer | Sale Price | Title Company |
|---|---|---|---|
| Hemenway Levin P | $255,000 | -- | |
| Creon Katherine T | -- | -- | |
| Burt Elizabeth M | $193,000 | -- |
Source: Public Records
Mortgage History
| Date | Status | Borrower | Loan Amount |
|---|---|---|---|
| Open | Creon Katherine T | $204,000 | |
| Closed | Burt Elizabeth M | $204,000 | |
| Previous Owner | Burt Elizabeth M | $154,400 |
Source: Public Records
Tax History Compared to Growth
Tax History
| Year | Tax Paid | Tax Assessment Tax Assessment Total Assessment is a certain percentage of the fair market value that is determined by local assessors to be the total taxable value of land and additions on the property. | Land | Improvement |
|---|---|---|---|---|
| 2024 | $7,977 | $288,100 | $120,500 | $167,600 |
| 2023 | $7,738 | $288,100 | $120,500 | $167,600 |
| 2022 | $7,459 | $288,100 | $120,500 | $167,600 |
| 2021 | $7,149 | $284,600 | $120,500 | $164,100 |
| 2020 | $6,851 | $256,000 | $94,900 | $161,100 |
| 2019 | $6,537 | $235,300 | $98,600 | $136,700 |
| 2018 | $3,923 | $226,800 | $98,900 | $127,900 |
| 2017 | $6,139 | $217,400 | $98,900 | $118,500 |
| 2016 | $5,836 | $210,900 | $97,100 | $113,800 |
| 2015 | $5,473 | $205,900 | $105,300 | $100,600 |
| 2014 | $4,077 | $205,900 | $105,300 | $100,600 |
| 2013 | -- | $205,900 | $105,300 | $100,600 |
| 2012 | -- | $227,500 | $122,900 | $104,600 |
Source: Public Records
Map
Nearby Homes
- 32 Carter St
- 122 South St
- 0 South St Unit 4969509
- 105 S Main St
- 33 Spruce St
- 0 Spruce St Unit 88
- 24 Badger St
- 15 Wilson Ave
- 22 Wilson Ave
- 14 Downing St
- 37 Thorndike St
- 75 S State St
- 14-16 Perley St
- 10 Perley St
- 376 S Main St
- 87 S Main St Unit 2
- 25 Fayette St
- 289 South St
- 54 Pleasant St Unit 8
- 73 Warren St Unit 3