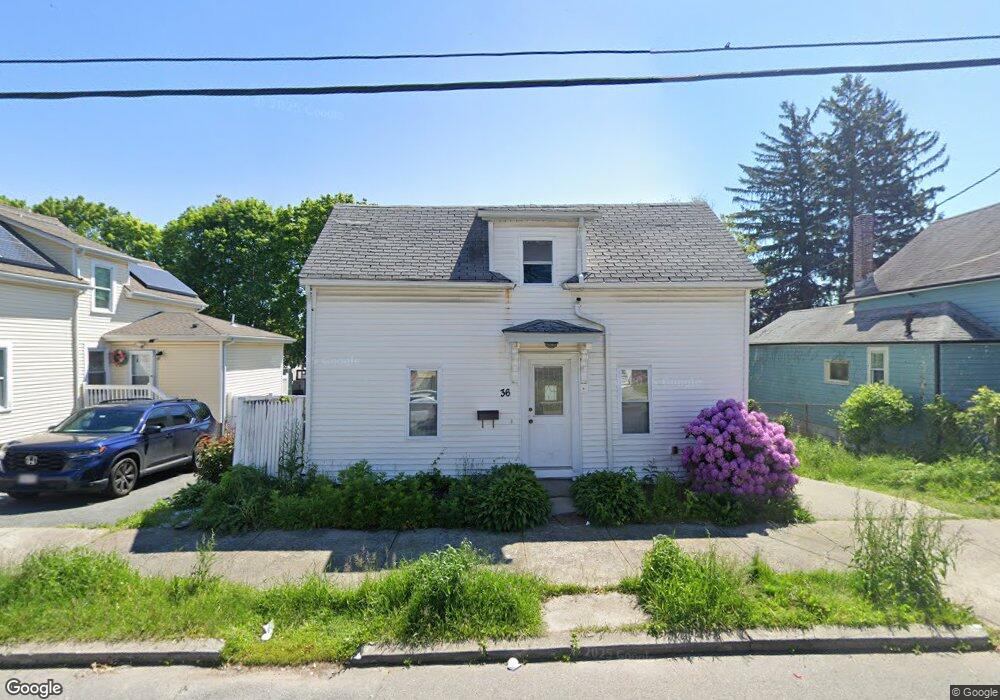
36 Laurel St Unit 36 Lynn, MA 01905
West Lynn NeighborhoodEstimated Value: $502,000 - $645,000
4
Beds
2
Baths
1,650
Sq Ft
$344/Sq Ft
Est. Value
About This Home
This home is located at 36 Laurel St Unit 36, Lynn, MA 01905 and is currently estimated at $567,017, approximately $343 per square foot. 36 Laurel St Unit 36 is a home located in Essex County with nearby schools including North Park Elementary School, William R. Fallon School, and Drewicz Elementary School.
Ownership History
Date
Name
Owned For
Owner Type
Purchase Details
Closed on
Jun 18, 2025
Sold by
Alhady Gawdat
Bought by
Kansour Rabaa
Current Estimated Value
Purchase Details
Closed on
Jan 22, 2021
Sold by
Alhady Realty Llc
Bought by
Alhady Gawdat and Alhady Mohamad
Purchase Details
Closed on
Dec 20, 2013
Sold by
Alhady Gawdat and Alhady Mohamad
Bought by
Alhady Realty Llc
Purchase Details
Closed on
Oct 31, 2012
Sold by
Department Of Housing & Urban Dev
Bought by
Alhady Gawdat and Alhady Mohamad
Purchase Details
Closed on
Jul 23, 2012
Sold by
Wells Fargo Bank Na
Bought by
Department Of Housing & Urban Dev
Purchase Details
Closed on
Oct 16, 1998
Sold by
Est Mcadam Mary E and Fournier Mildred F
Bought by
Murray Stanley A and Murray Normita G
Create a Home Valuation Report for This Property
The Home Valuation Report is an in-depth analysis detailing your home's value as well as a comparison with similar homes in the area
Home Values in the Area
Average Home Value in this Area
Purchase History
| Date | Buyer | Sale Price | Title Company |
|---|---|---|---|
| Kansour Rabaa | -- | None Available | |
| Kansour Rabaa | -- | None Available | |
| Kansour Rabaa | -- | None Available | |
| Alhady Gawdat | -- | None Available | |
| Alhady Gawdat | -- | None Available | |
| Alhady Gawdat | -- | None Available | |
| Alhady Realty Llc | -- | -- | |
| Alhady Realty Llc | -- | -- | |
| Alhady Gawdat | $74,000 | -- | |
| Alhady Gawdat | $74,000 | -- | |
| Department Of Housing & Urban Dev | -- | -- | |
| Department Of Housing & Urban Dev | -- | -- | |
| Murray Stanley A | $60,000 | -- | |
| Murray Stanley A | $60,000 | -- |
Source: Public Records
Mortgage History
| Date | Status | Borrower | Loan Amount |
|---|---|---|---|
| Previous Owner | Murray Stanley A | $196,886 | |
| Previous Owner | Murray Stanley A | $169,500 |
Source: Public Records
Tax History Compared to Growth
Tax History
| Year | Tax Paid | Tax Assessment Tax Assessment Total Assessment is a certain percentage of the fair market value that is determined by local assessors to be the total taxable value of land and additions on the property. | Land | Improvement |
|---|---|---|---|---|
| 2025 | $4,895 | $472,500 | $196,400 | $276,100 |
| 2024 | $4,675 | $444,000 | $182,700 | $261,300 |
| 2023 | $4,812 | $431,600 | $202,000 | $229,600 |
| 2022 | $4,479 | $360,300 | $154,700 | $205,600 |
| 2021 | $4,248 | $326,000 | $133,700 | $192,300 |
| 2020 | $4,217 | $314,700 | $137,100 | $177,600 |
| 2019 | $4,148 | $290,100 | $122,500 | $167,600 |
| 2018 | $3,813 | $251,700 | $110,500 | $141,200 |
| 2017 | $3,571 | $228,900 | $96,700 | $132,200 |
| 2016 | $3,463 | $214,000 | $89,000 | $125,000 |
| 2015 | $3,370 | $201,200 | $91,500 | $109,700 |
Source: Public Records
Map
Nearby Homes
- 79 Laurel St
- 100 Ashland St
- 86 Laurel St
- 16 Linden St
- 45 Cottage St Unit 3
- 28 Wyman St
- 92-94 Newton Ave
- 35 Curran Rd
- 28 Margin St Unit A
- 20 Murray St
- 505-507 Boston St
- 20 Houston St
- 19 Hood St
- 16 River St Unit 6
- 110 Holyoke St
- 3 River Street Ct
- 9 Needhams Landing
- 725 Boston St
- 14 River Street Place
- 29 Fenton Ave