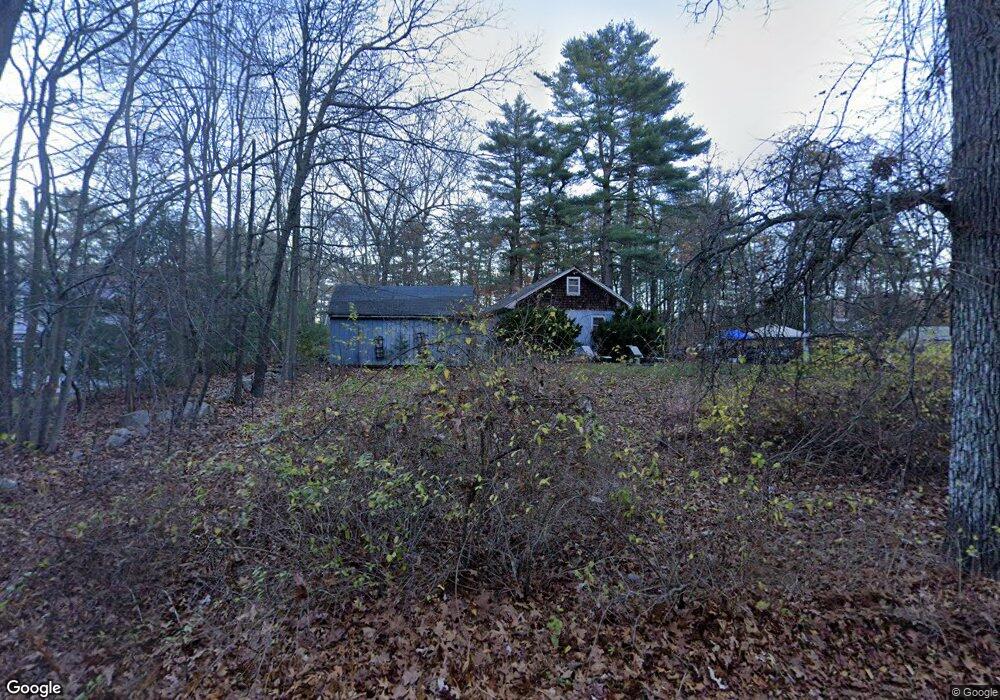
36 Locust St Salisbury, MA 01952
Estimated Value: $428,737 - $694,000
2
Beds
2
Baths
768
Sq Ft
$695/Sq Ft
Est. Value
About This Home
This home is located at 36 Locust St, Salisbury, MA 01952 and is currently estimated at $533,684, approximately $694 per square foot. 36 Locust St is a home located in Essex County with nearby schools including Triton Regional High School.
Ownership History
Date
Name
Owned For
Owner Type
Purchase Details
Closed on
Aug 26, 1996
Sold by
Fer Rt and Carvalho Gail
Bought by
Case Sean M and Ells Lisa
Current Estimated Value
Home Financials for this Owner
Home Financials are based on the most recent Mortgage that was taken out on this home.
Original Mortgage
$130,500
Outstanding Balance
$11,405
Interest Rate
8.4%
Mortgage Type
Purchase Money Mortgage
Estimated Equity
$522,279
Create a Home Valuation Report for This Property
The Home Valuation Report is an in-depth analysis detailing your home's value as well as a comparison with similar homes in the area
Home Values in the Area
Average Home Value in this Area
Purchase History
| Date | Buyer | Sale Price | Title Company |
|---|---|---|---|
| Case Sean M | $145,000 | -- |
Source: Public Records
Mortgage History
| Date | Status | Borrower | Loan Amount |
|---|---|---|---|
| Open | Case Sean M | $130,500 |
Source: Public Records
Tax History
| Year | Tax Paid | Tax Assessment Tax Assessment Total Assessment is a certain percentage of the fair market value that is determined by local assessors to be the total taxable value of land and additions on the property. | Land | Improvement |
|---|---|---|---|---|
| 2025 | $3,200 | $317,500 | $162,100 | $155,400 |
| 2024 | $3,156 | $302,000 | $162,100 | $139,900 |
| 2023 | $3,101 | $287,100 | $162,100 | $125,000 |
| 2022 | $2,924 | $262,500 | $147,400 | $115,100 |
| 2021 | $2,884 | $256,100 | $147,400 | $108,700 |
| 2020 | $2,796 | $244,000 | $149,100 | $94,900 |
| 2019 | $2,830 | $238,600 | $149,100 | $89,500 |
| 2018 | $2,799 | $237,600 | $149,100 | $88,500 |
| 2017 | $2,498 | $209,600 | $127,800 | $81,800 |
| 2016 | $2,388 | $204,600 | $121,400 | $83,200 |
| 2015 | $2,270 | $193,200 | $121,400 | $71,800 |
Source: Public Records
Map
Nearby Homes
- 241 & 245 Lafayette Rd
- 6 Forest Dr
- 9 Elmwood St
- 188 Lafayette Rd
- 7 Toll Rd
- 35 Brooks Rd Unit 1
- 47 Scott Ave
- 6 Janvrin Dr
- 25 Bayberry Ln
- 84 Blacksnake Rd Unit B
- 154 Lafayette Rd
- 24 Adder Ln
- 2 Adder Ln
- 82 Monroe St
- 4 Woodland Ave
- 35 New Zealand Rd
- 151 Walton Rd
- 53 Rabbit Rd
- 42 Kendell Ln
- 167 Staples St
Your Personal Tour Guide
Ask me questions while you tour the home.