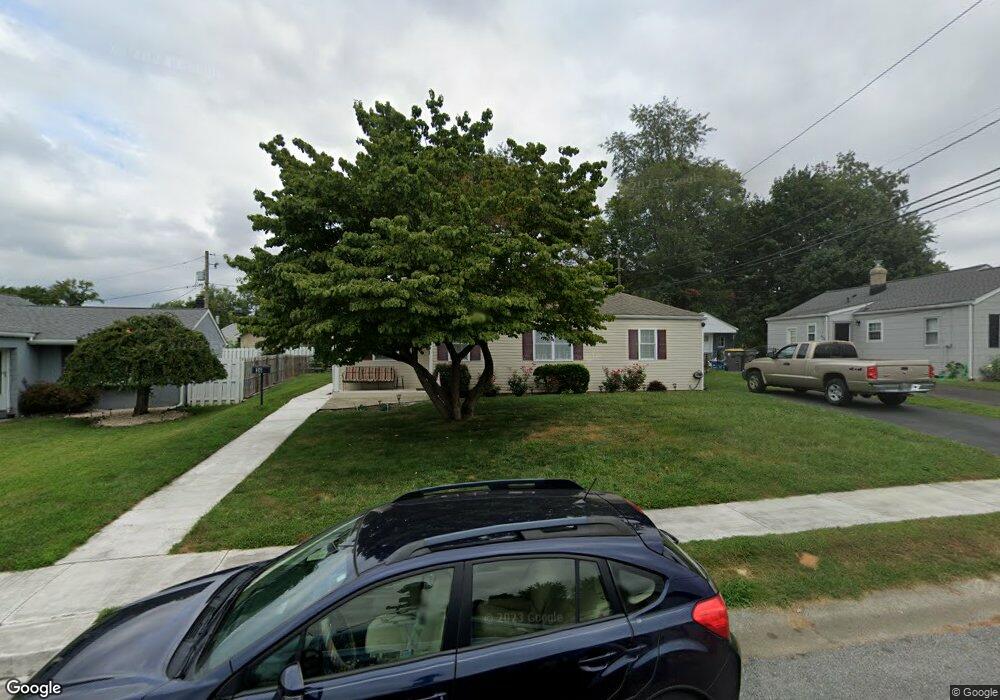
36 Lynbrook Rd Wilmington, DE 19804
Ashley NeighborhoodEstimated Value: $277,000 - $303,057
About This Home
This home is located at 36 Lynbrook Rd, Wilmington, DE 19804 and is currently estimated at $288,264, approximately $234 per square foot. 36 Lynbrook Rd is a home located in New Castle County with nearby schools including Richey Elementary School, Stanton Middle School, and The John Dickinson School.
Ownership History
We collect this data history from publicly available records. To have your information removed, we recommend requesting removal directly through your county’s website.
Purchase Details
Home Financials for this Owner
Home Financials are based on the most recent Mortgage that was taken out on this home.Home Values in the Area
Average Home Value in this Area
Purchase History
We collect this data history from publicly available records. To have your information removed, we recommend requesting removal directly through your county’s website.
| Date | Buyer | Sale Price | Title Company |
|---|---|---|---|
| -- | -- |
Mortgage History
We collect this data history from publicly available records. To have your information removed, we recommend requesting removal directly through your county’s website.
| Date | Status | Borrower | Loan Amount |
|---|---|---|---|
| Closed | $121,700 | ||
| Closed | $52,904 | ||
| Closed | $31,330 | ||
| Closed | $138,600 | ||
| Closed | $17,388 |
Tax History
We collect this data history from publicly available records. To have your information removed, we recommend requesting removal directly through your county’s website.
| Year | Tax Paid | Tax Assessment Tax Assessment Total Assessment is a certain percentage of the fair market value that is determined by local assessors to be the total taxable value of land and additions on the property. | Land | Improvement |
|---|---|---|---|---|
| 2025 | $2,090 | $258,400 | $57,400 | $201,000 |
| 2024 | $1,476 | $38,900 | $7,900 | $31,000 |
| 2023 | $1,306 | $38,900 | $7,900 | $31,000 |
| 2022 | $1,315 | $38,900 | $7,900 | $31,000 |
| 2021 | $1,314 | $38,900 | $7,900 | $31,000 |
| 2020 | $1,317 | $38,900 | $7,900 | $31,000 |
| 2019 | $1,468 | $38,900 | $7,900 | $31,000 |
| 2018 | $1,290 | $38,900 | $7,900 | $31,000 |
| 2017 | $1,275 | $38,900 | $7,900 | $31,000 |
| 2016 | $1,217 | $38,900 | $7,900 | $31,000 |
| 2015 | $1,141 | $38,900 | $7,900 | $31,000 |
| 2014 | $1,059 | $38,900 | $7,900 | $31,000 |
Map
- 717 Garnet Rd
- 507 Farwell Rd
- 309 2nd Ave
- 210 E Highland Ave
- 4 Glover Cir
- 30 North Ave
- 7 Roosevelt Ave
- 216 E Market St
- 111 Meadowbrook Ave
- 523 Essex Ave
- 218 Meadowbrook Ave
- 300 Park Ln
- 302 S Clifton Ave
- 1602 E Ayre St
- 130 Hayden Ave
- 11 Fleetwood Ct Unit 22
- 212 W Reamer Ave
- 201 Westmoreland Ave
- 1401 E Ayre St
- 102 Kentucky Ave
Ask me questions while you tour the home.