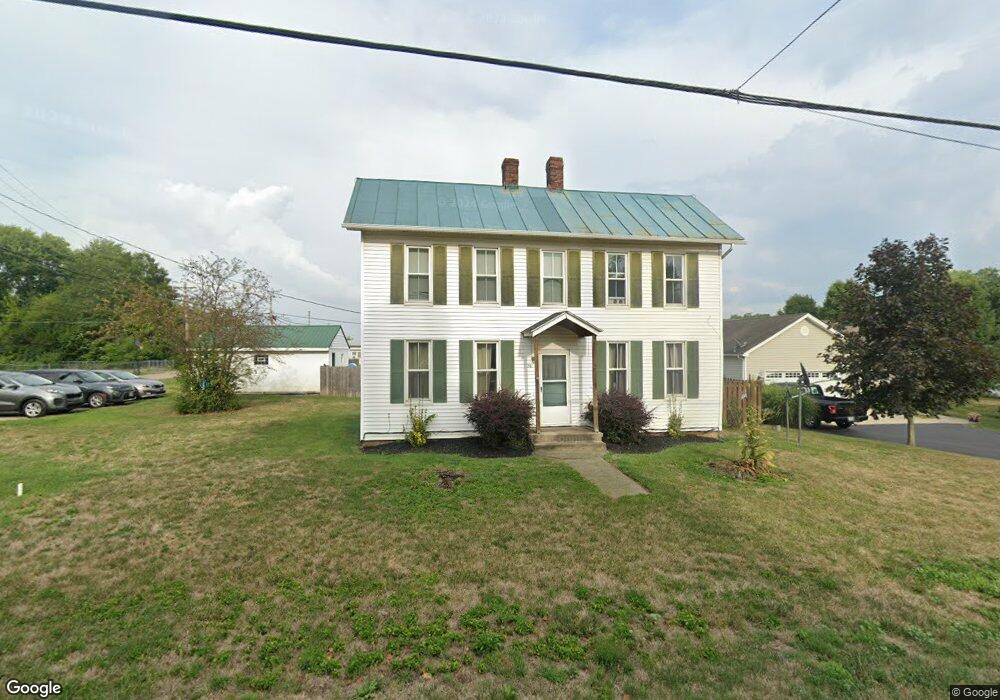
36 Main St Orient, OH 43146
Estimated Value: $179,000 - $292,000
3
Beds
1
Bath
1,472
Sq Ft
$155/Sq Ft
Est. Value
About This Home
This home is located at 36 Main St, Orient, OH 43146 and is currently estimated at $228,079, approximately $154 per square foot. 36 Main St is a home located in Pickaway County.
Ownership History
Date
Name
Owned For
Owner Type
Purchase Details
Closed on
May 17, 2016
Sold by
Beavers Rhonda D
Bought by
Hill Keavin R and The Trust Of Keavin R Hill
Current Estimated Value
Purchase Details
Closed on
Apr 27, 2016
Sold by
Beavers Kevin R
Bought by
Beavers Rhonda D
Purchase Details
Closed on
May 29, 2013
Sold by
Beavers Kevin R
Bought by
Beavers Kevin R and Beavers Rhonda D
Home Financials for this Owner
Home Financials are based on the most recent Mortgage that was taken out on this home.
Original Mortgage
$91,300
Interest Rate
3.34%
Mortgage Type
New Conventional
Purchase Details
Closed on
Apr 16, 1998
Sold by
Snyder Hazel and Snyder Rasor
Bought by
Beavers Kevin R
Home Financials for this Owner
Home Financials are based on the most recent Mortgage that was taken out on this home.
Original Mortgage
$85,300
Interest Rate
7.27%
Mortgage Type
New Conventional
Purchase Details
Closed on
Aug 26, 1991
Sold by
Rasor Jerry C
Bought by
Rasor Hazel Snyder
Create a Home Valuation Report for This Property
The Home Valuation Report is an in-depth analysis detailing your home's value as well as a comparison with similar homes in the area
Home Values in the Area
Average Home Value in this Area
Purchase History
| Date | Buyer | Sale Price | Title Company |
|---|---|---|---|
| Hill Keavin R | $115,000 | Attorney | |
| Beavers Rhonda D | -- | Attorney | |
| Beavers Kevin R | -- | None Available | |
| Beavers Kevin R | $88,000 | -- | |
| Rasor Hazel Snyder | -- | -- |
Source: Public Records
Mortgage History
| Date | Status | Borrower | Loan Amount |
|---|---|---|---|
| Previous Owner | Beavers Kevin R | $91,300 | |
| Previous Owner | Beavers Kevin R | $85,300 |
Source: Public Records
Tax History
| Year | Tax Paid | Tax Assessment Tax Assessment Total Assessment is a certain percentage of the fair market value that is determined by local assessors to be the total taxable value of land and additions on the property. | Land | Improvement |
|---|---|---|---|---|
| 2024 | $2,740 | $53,090 | $4,510 | $48,580 |
| 2023 | $1,997 | $53,090 | $4,510 | $48,580 |
| 2022 | $1,725 | $42,140 | $3,830 | $38,310 |
| 2021 | $1,731 | $42,140 | $3,830 | $38,310 |
| 2020 | $1,731 | $42,140 | $3,830 | $38,310 |
| 2019 | $1,245 | $33,970 | $3,830 | $30,140 |
| 2018 | $1,324 | $33,970 | $3,830 | $30,140 |
| 2017 | $1,359 | $33,970 | $3,830 | $30,140 |
| 2016 | $1,054 | $26,310 | $3,810 | $22,500 |
| 2015 | $1,054 | $26,280 | $3,780 | $22,500 |
| 2014 | $1,055 | $26,280 | $3,780 | $22,500 |
| 2013 | $1,129 | $26,280 | $3,780 | $22,500 |
Source: Public Records
Map
Nearby Homes
- 305 Cherry Hills Rd
- 24 Erin Hills Rd
- 290 Olympic Loop
- 305 Olympic Loop
- 358 Oakmont Dr
- 359 Oakmont Dr
- 426 Bethpage Blvd
- 304 Cherry Hills Rd
- 277 Olympic Loop
- 284 Olympic Loop
- 282 Olympic Loop
- 507 Walker Pointe Dr
- 320 Cherry Hills Rd
- 338 Cherry Hills Rd
- 55 Genoa Cir
- 66 Genoa Cir
- 315 Genoa Rd
- 484 Creekside Dr
- 502 Conley Dr
- 500 Walker Pointe Dr
Your Personal Tour Guide
Ask me questions while you tour the home.