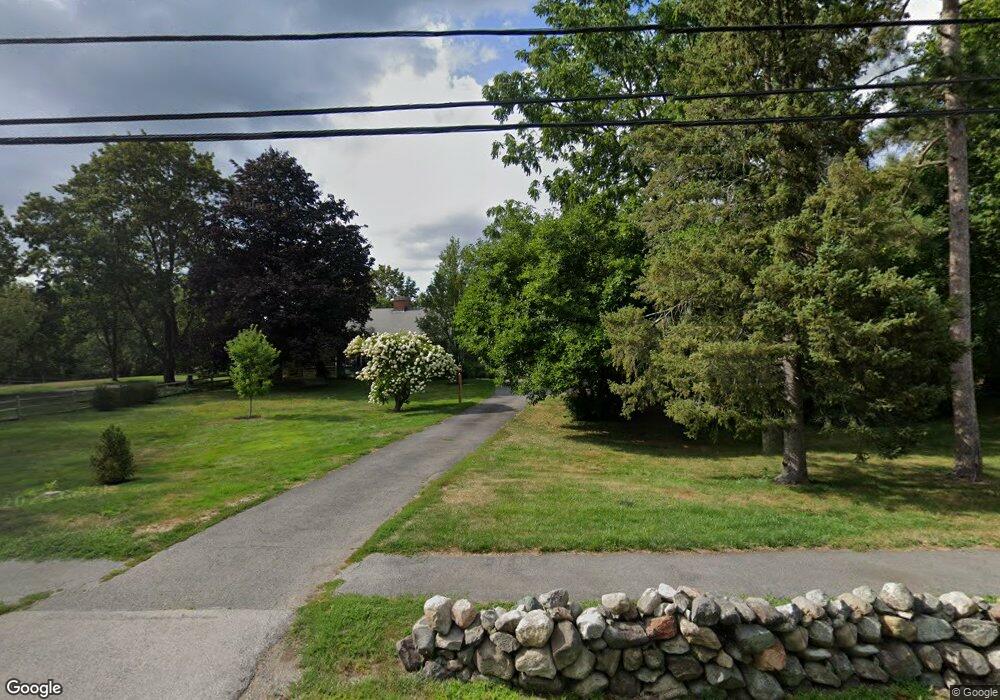
36 Maple St Wenham, MA 01984
Estimated Value: $810,000 - $1,196,000
3
Beds
2
Baths
2,042
Sq Ft
$472/Sq Ft
Est. Value
About This Home
This home is located at 36 Maple St, Wenham, MA 01984 and is currently estimated at $964,590, approximately $472 per square foot. 36 Maple St is a home located in Essex County with nearby schools including Winthrop School, Bessie Buker Elementary School, and Cutler Elementary School.
Ownership History
Date
Name
Owned For
Owner Type
Purchase Details
Closed on
Jun 28, 2013
Sold by
Coughlin Kevin J
Bought by
Kevin J Coughlin Ret and Coughlin Kevin J
Current Estimated Value
Purchase Details
Closed on
Mar 17, 2010
Sold by
Donovan Kevin P and Donovan Laurie A
Bought by
Coughlin Kevin J
Purchase Details
Closed on
May 13, 2002
Sold by
Jedjam Dev Corp
Bought by
Donovan Kevin and Donovan Laurie
Purchase Details
Closed on
Oct 2, 2001
Sold by
Cronin Arlene R and Coulter-Smith Nelda
Bought by
Jedjam Dev Corp
Create a Home Valuation Report for This Property
The Home Valuation Report is an in-depth analysis detailing your home's value as well as a comparison with similar homes in the area
Home Values in the Area
Average Home Value in this Area
Purchase History
| Date | Buyer | Sale Price | Title Company |
|---|---|---|---|
| Kevin J Coughlin Ret | -- | -- | |
| Coughlin Kevin J | $467,500 | -- | |
| Donovan Kevin | $447,500 | -- | |
| Jedjam Dev Corp | $660,000 | -- |
Source: Public Records
Mortgage History
| Date | Status | Borrower | Loan Amount |
|---|---|---|---|
| Previous Owner | Jedjam Dev Corp | $50,000 | |
| Previous Owner | Jedjam Dev Corp | $309,000 |
Source: Public Records
Tax History
| Year | Tax Paid | Tax Assessment Tax Assessment Total Assessment is a certain percentage of the fair market value that is determined by local assessors to be the total taxable value of land and additions on the property. | Land | Improvement |
|---|---|---|---|---|
| 2025 | $11,978 | $770,800 | $434,600 | $336,200 |
| 2024 | $11,786 | $752,600 | $434,600 | $318,000 |
| 2023 | $11,356 | $654,500 | $420,400 | $234,100 |
| 2022 | $10,979 | $560,700 | $339,400 | $221,300 |
| 2021 | $10,535 | $535,300 | $314,000 | $221,300 |
| 2020 | $9,917 | $523,600 | $314,100 | $209,500 |
| 2019 | $9,435 | $523,600 | $314,100 | $209,500 |
| 2018 | $8,905 | $473,900 | $304,100 | $169,800 |
| 2017 | $8,687 | $473,900 | $304,100 | $169,800 |
| 2016 | $8,038 | $473,400 | $304,100 | $169,300 |
| 2015 | $7,693 | $473,400 | $304,100 | $169,300 |
Source: Public Records
Map
Nearby Homes
Your Personal Tour Guide
Ask me questions while you tour the home.