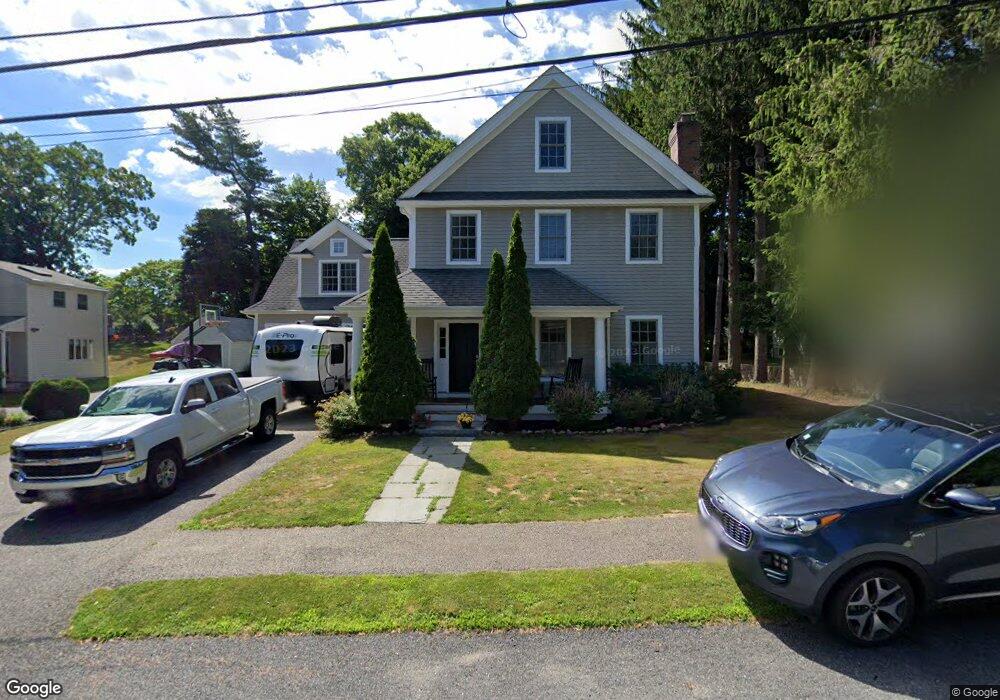
36 Nevada Rd Needham Heights, MA 02494
Estimated Value: $2,133,000 - $2,293,000
4
Beds
3
Baths
3,500
Sq Ft
$642/Sq Ft
Est. Value
About This Home
This home is located at 36 Nevada Rd, Needham Heights, MA 02494 and is currently estimated at $2,245,836, approximately $641 per square foot. 36 Nevada Rd is a home located in Norfolk County with nearby schools including Mitchell Elementary School, High Rock Middle School, and Pollard Middle School.
Ownership History
Date
Name
Owned For
Owner Type
Purchase Details
Closed on
Feb 2, 2005
Sold by
Bossert Ellen W and Bossert Suzanne W
Bought by
Bossert Ellen W and Bossert Suzanne W
Current Estimated Value
Purchase Details
Closed on
Aug 13, 2004
Sold by
Heritage Cons Dev Inc
Bought by
Bossert Ellen W and Bossert Suzanne W
Home Financials for this Owner
Home Financials are based on the most recent Mortgage that was taken out on this home.
Original Mortgage
$250,000
Interest Rate
6.16%
Mortgage Type
Purchase Money Mortgage
Purchase Details
Closed on
Jun 11, 2003
Sold by
Biggins Kellie K and Speed Cheryl T
Bought by
Heritage Construction
Home Financials for this Owner
Home Financials are based on the most recent Mortgage that was taken out on this home.
Original Mortgage
$711,920
Interest Rate
5.77%
Mortgage Type
Purchase Money Mortgage
Create a Home Valuation Report for This Property
The Home Valuation Report is an in-depth analysis detailing your home's value as well as a comparison with similar homes in the area
Home Values in the Area
Average Home Value in this Area
Purchase History
| Date | Buyer | Sale Price | Title Company |
|---|---|---|---|
| Bossert Ellen W | -- | -- | |
| Bossert Ellen W | -- | -- | |
| Bossert Ellen W | $1,075,000 | -- | |
| Bossert Ellen W | $1,075,000 | -- | |
| Heritage Construction | $414,900 | -- | |
| Heritage Construction | $414,900 | -- |
Source: Public Records
Mortgage History
| Date | Status | Borrower | Loan Amount |
|---|---|---|---|
| Previous Owner | Bossert Ellen W | $250,000 | |
| Previous Owner | Heritage Construction | $711,920 |
Source: Public Records
Tax History
| Year | Tax Paid | Tax Assessment Tax Assessment Total Assessment is a certain percentage of the fair market value that is determined by local assessors to be the total taxable value of land and additions on the property. | Land | Improvement |
|---|---|---|---|---|
| 2025 | $21,833 | $2,059,700 | $772,800 | $1,286,900 |
| 2024 | $20,107 | $1,606,000 | $552,000 | $1,054,000 |
| 2023 | $19,732 | $1,513,200 | $552,000 | $961,200 |
| 2022 | $18,632 | $1,393,600 | $484,200 | $909,400 |
| 2021 | $18,159 | $1,393,600 | $484,200 | $909,400 |
| 2020 | $17,783 | $1,423,800 | $484,100 | $939,700 |
| 2019 | $16,813 | $1,357,000 | $440,100 | $916,900 |
| 2018 | $16,121 | $1,357,000 | $440,100 | $916,900 |
| 2017 | $14,790 | $1,243,900 | $440,100 | $803,800 |
| 2016 | $14,355 | $1,243,900 | $440,100 | $803,800 |
| 2015 | $14,044 | $1,243,900 | $440,100 | $803,800 |
| 2014 | $13,657 | $1,173,300 | $400,100 | $773,200 |
Source: Public Records
Map
Nearby Homes
- 168 Richdale Rd
- 143 Hunting Rd
- 5 Hazel Ln
- 40 High St
- 108 Woodbine Cir
- 7 West St
- 5 Sachem Rd
- 638 Webster St
- 638 Webster St Unit 638
- 132 Hillside Ave
- 400 Hunnewell St Unit 103
- 62 Evelyn Rd
- 140 Hillside Ave
- 140 Hillside Ave Unit a
- 379 Hunnewell St Unit 379
- 3 Crescent Rd
- 447 Hillside Ave
- 18 Crescent Rd
- 100 Rosemary Way Unit 129
- 40 Otis St Unit L
Your Personal Tour Guide
Ask me questions while you tour the home.