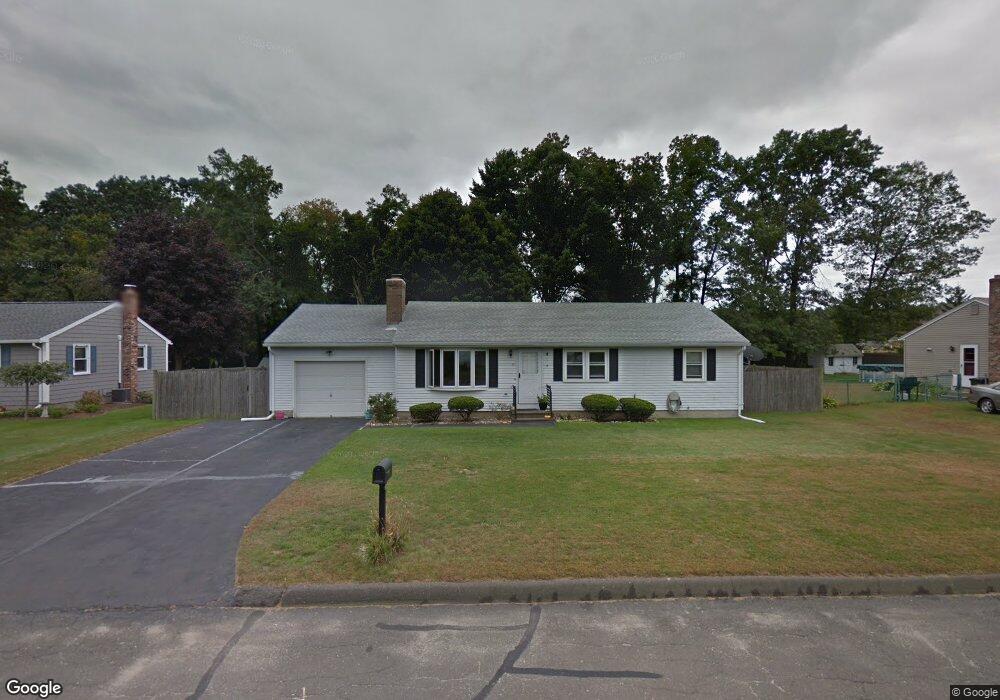
36 Overlook Dr Easthampton, MA 01027
Estimated Value: $360,843 - $424,000
3
Beds
1
Bath
1,144
Sq Ft
$339/Sq Ft
Est. Value
About This Home
This home is located at 36 Overlook Dr, Easthampton, MA 01027 and is currently estimated at $388,211, approximately $339 per square foot. 36 Overlook Dr is a home located in Hampshire County with nearby schools including Easthampton High School, Calvary Baptist Christian School, and Tri-County Schools.
Ownership History
Date
Name
Owned For
Owner Type
Purchase Details
Closed on
Jul 1, 2008
Sold by
Niemiec Matthew
Bought by
Sulisz Sara J
Current Estimated Value
Home Financials for this Owner
Home Financials are based on the most recent Mortgage that was taken out on this home.
Original Mortgage
$156,200
Outstanding Balance
$100,769
Interest Rate
6.07%
Mortgage Type
Purchase Money Mortgage
Estimated Equity
$287,442
Create a Home Valuation Report for This Property
The Home Valuation Report is an in-depth analysis detailing your home's value as well as a comparison with similar homes in the area
Home Values in the Area
Average Home Value in this Area
Purchase History
| Date | Buyer | Sale Price | Title Company |
|---|---|---|---|
| Sulisz Sara J | $219,000 | -- |
Source: Public Records
Mortgage History
| Date | Status | Borrower | Loan Amount |
|---|---|---|---|
| Open | Sulisz Sara J | $156,200 |
Source: Public Records
Tax History
| Year | Tax Paid | Tax Assessment Tax Assessment Total Assessment is a certain percentage of the fair market value that is determined by local assessors to be the total taxable value of land and additions on the property. | Land | Improvement |
|---|---|---|---|---|
| 2025 | $4,363 | $319,200 | $118,700 | $200,500 |
| 2024 | $4,210 | $310,500 | $115,200 | $195,300 |
| 2023 | $3,210 | $219,100 | $90,600 | $128,500 |
| 2022 | $3,622 | $219,100 | $90,600 | $128,500 |
| 2021 | $3,955 | $225,500 | $90,600 | $134,900 |
| 2020 | $3,891 | $219,100 | $90,600 | $128,500 |
| 2019 | $3,499 | $226,300 | $90,600 | $135,700 |
| 2018 | $3,354 | $209,600 | $85,600 | $124,000 |
| 2017 | $3,274 | $202,000 | $82,300 | $119,700 |
| 2016 | $3,149 | $202,000 | $82,300 | $119,700 |
| 2015 | $3,060 | $202,000 | $82,300 | $119,700 |
Source: Public Records
Map
Nearby Homes
Your Personal Tour Guide
Ask me questions while you tour the home.