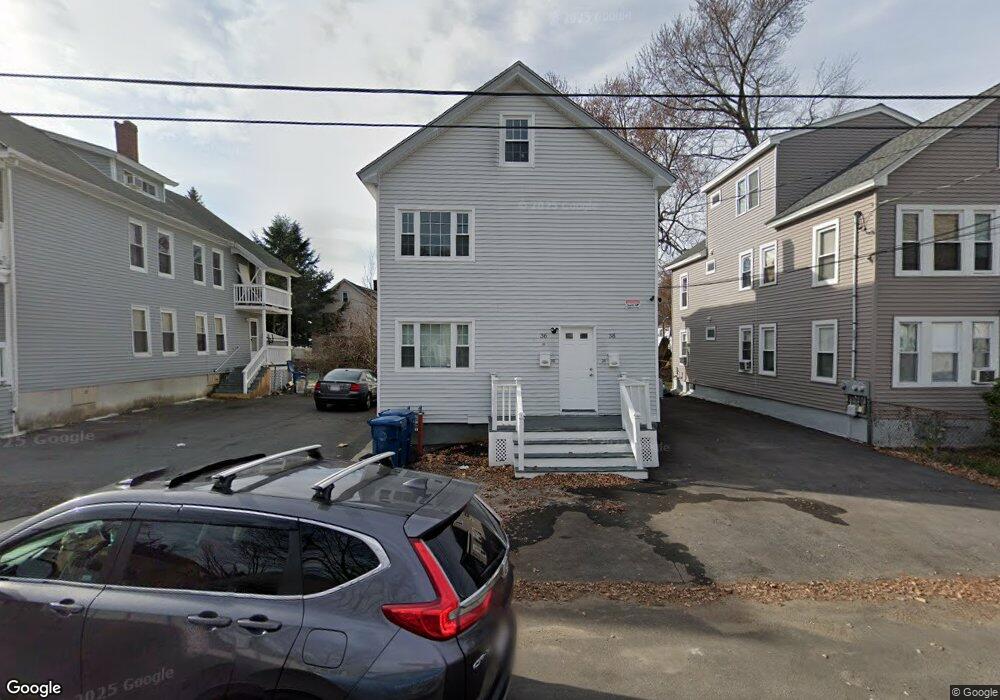
36 Perry Ave Unit 38 Lawrence, MA 01841
Tower Hill NeighborhoodEstimated Value: $599,547 - $738,000
4
Beds
2
Baths
1,936
Sq Ft
$356/Sq Ft
Est. Value
About This Home
This home is located at 36 Perry Ave Unit 38, Lawrence, MA 01841 and is currently estimated at $688,637, approximately $355 per square foot. 36 Perry Ave Unit 38 is a home located in Essex County with nearby schools including Alexander B. Bruce School, School For Exceptional Studies, and Lawrence Family Development Charter School.
Ownership History
Date
Name
Owned For
Owner Type
Purchase Details
Closed on
Dec 22, 2022
Sold by
Manzueta Clarissa D and Manzueta Matilde
Bought by
Manzueta C D
Current Estimated Value
Home Financials for this Owner
Home Financials are based on the most recent Mortgage that was taken out on this home.
Original Mortgage
$449,848
Outstanding Balance
$436,359
Interest Rate
6.58%
Mortgage Type
FHA
Estimated Equity
$252,278
Purchase Details
Closed on
Jul 6, 2018
Sold by
Ramirez Darien and Rodriguez Reynaldo
Bought by
Manzueta Delacruz-Manzueta C and Manzueta Matilde
Home Financials for this Owner
Home Financials are based on the most recent Mortgage that was taken out on this home.
Original Mortgage
$375,050
Interest Rate
4.62%
Mortgage Type
FHA
Purchase Details
Closed on
Dec 21, 2017
Sold by
Degagne David
Bought by
Ramirez Darien and Rodriguez Reynaldo
Purchase Details
Closed on
Jan 26, 2004
Sold by
Catineau Eugene L and Catineau Helen E
Bought by
Degagne David
Home Financials for this Owner
Home Financials are based on the most recent Mortgage that was taken out on this home.
Original Mortgage
$194,000
Interest Rate
5.89%
Mortgage Type
Purchase Money Mortgage
Create a Home Valuation Report for This Property
The Home Valuation Report is an in-depth analysis detailing your home's value as well as a comparison with similar homes in the area
Home Values in the Area
Average Home Value in this Area
Purchase History
| Date | Buyer | Sale Price | Title Company |
|---|---|---|---|
| Manzueta C D | -- | None Available | |
| Manzueta Delacruz-Manzueta C | $388,000 | -- | |
| Ramirez Darien | $235,000 | -- | |
| Degagne David | $196,000 | -- |
Source: Public Records
Mortgage History
| Date | Status | Borrower | Loan Amount |
|---|---|---|---|
| Open | Manzueta C D | $449,848 | |
| Previous Owner | Manzueta Delacruz-Manzueta C | $375,050 | |
| Previous Owner | Rodriguez Reynaldo | $226,250 | |
| Previous Owner | Degagne David M | $40,000 | |
| Previous Owner | Degagne David M | $25,000 | |
| Previous Owner | Degagne David M | $8,700 | |
| Previous Owner | Degagne David | $194,000 |
Source: Public Records
Tax History
| Year | Tax Paid | Tax Assessment Tax Assessment Total Assessment is a certain percentage of the fair market value that is determined by local assessors to be the total taxable value of land and additions on the property. | Land | Improvement |
|---|---|---|---|---|
| 2025 | $5,006 | $568,900 | $112,900 | $456,000 |
| 2024 | $4,714 | $509,600 | $109,200 | $400,400 |
| 2023 | $4,864 | $478,700 | $95,600 | $383,100 |
| 2022 | $4,306 | $376,400 | $88,800 | $287,600 |
| 2021 | $4,205 | $342,700 | $88,800 | $253,900 |
| 2020 | $3,934 | $316,500 | $75,300 | $241,200 |
| 2019 | $3,664 | $267,800 | $65,200 | $202,600 |
| 2018 | $3,481 | $243,100 | $62,300 | $180,800 |
| 2017 | $3,182 | $207,400 | $60,100 | $147,300 |
| 2016 | $3,155 | $203,400 | $42,700 | $160,700 |
| 2015 | $2,986 | $197,500 | $42,700 | $154,800 |
Source: Public Records
Map
Nearby Homes
- 42-44 Cypress Ave
- 14-16 Cypress Ave
- 88-90 Columbus Ave
- 76 Haverhill St
- 1100 Essex St
- 1082 Essex St
- 1146 Essex St
- 1008 Essex St Unit 1010
- 19 Oregon Ave
- 70 Butler St
- 62-66 Butler St
- 50 Forest St
- 45 Bodwell St
- 95 Hancock St
- 312 Water St Unit 4
- 179-181 West St
- 36 Manchester St
- 324-326 Broadway
- 65 Clayton Ave
- 202 Broadway Unit 3-3
- 36-38 Perry Ave
- 38 Perry Ave Unit 38
- 40 Perry Ave Unit 42
- 32-34 Perry Ave
- 42 Perry Ave Unit 2
- 32 Perry Ave Unit 34
- 44 Perry Ave Unit 46
- 28 Perry Ave Unit 30
- 38-40 Cypress Ave
- 42 Cypress Ave Unit 44
- 38 Cypress Ave Unit 40
- 72 Perry Ave
- 46 Cypress Ave Unit 48
- 46 Cypress Ave Unit 2
- 46 Cypress Ave Unit 1
- 31 Perry Ave
- 22 Perry Ave
- 34 Cypress Ave
- 36 Cypress Ave
- 29 Perry Ave
Your Personal Tour Guide
Ask me questions while you tour the home.