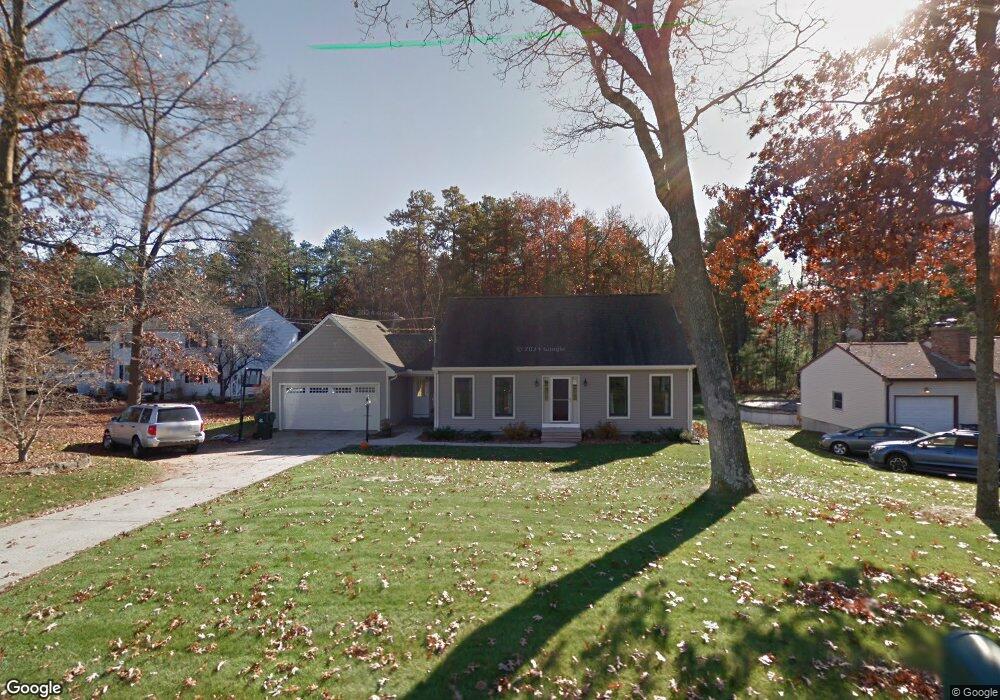
36 Plain St Easthampton, MA 01027
Estimated Value: $455,000 - $491,000
3
Beds
2
Baths
1,689
Sq Ft
$277/Sq Ft
Est. Value
About This Home
This home is located at 36 Plain St, Easthampton, MA 01027 and is currently estimated at $468,672, approximately $277 per square foot. 36 Plain St is a home located in Hampshire County with nearby schools including Easthampton High School, Calvary Baptist Christian School, and Tri-County Schools.
Ownership History
Date
Name
Owned For
Owner Type
Purchase Details
Closed on
Jul 31, 2001
Sold by
Kenyon William B
Bought by
Bolstrom Richard E and Sawyer-Bolstro Shannon
Current Estimated Value
Home Financials for this Owner
Home Financials are based on the most recent Mortgage that was taken out on this home.
Original Mortgage
$158,175
Interest Rate
7.18%
Mortgage Type
Purchase Money Mortgage
Create a Home Valuation Report for This Property
The Home Valuation Report is an in-depth analysis detailing your home's value as well as a comparison with similar homes in the area
Home Values in the Area
Average Home Value in this Area
Purchase History
| Date | Buyer | Sale Price | Title Company |
|---|---|---|---|
| Bolstrom Richard E | $166,500 | -- |
Source: Public Records
Mortgage History
| Date | Status | Borrower | Loan Amount |
|---|---|---|---|
| Open | Bolstrom Richard E | $212,800 | |
| Closed | Bolstrom Richard E | $171,900 | |
| Closed | Bolstrom Richard E | $158,175 | |
| Previous Owner | Bolstrom Richard E | $25,000 |
Source: Public Records
Tax History
| Year | Tax Paid | Tax Assessment Tax Assessment Total Assessment is a certain percentage of the fair market value that is determined by local assessors to be the total taxable value of land and additions on the property. | Land | Improvement |
|---|---|---|---|---|
| 2025 | $5,562 | $0 | $0 | $0 |
| 2024 | $5,562 | $410,200 | $111,300 | $298,900 |
| 2023 | $4,144 | $282,900 | $87,500 | $195,400 |
| 2022 | $4,676 | $282,900 | $87,500 | $195,400 |
| 2021 | $5,408 | $294,600 | $87,500 | $207,100 |
| 2020 | $5,024 | $282,900 | $87,500 | $195,400 |
| 2019 | $4,193 | $271,200 | $87,500 | $183,700 |
| 2018 | $4,043 | $252,700 | $82,600 | $170,100 |
| 2017 | $3,947 | $243,500 | $79,300 | $164,200 |
| 2016 | $3,802 | $243,900 | $79,300 | $164,600 |
| 2015 | $3,695 | $243,900 | $79,300 | $164,600 |
Source: Public Records
Map
Nearby Homes
Your Personal Tour Guide
Ask me questions while you tour the home.