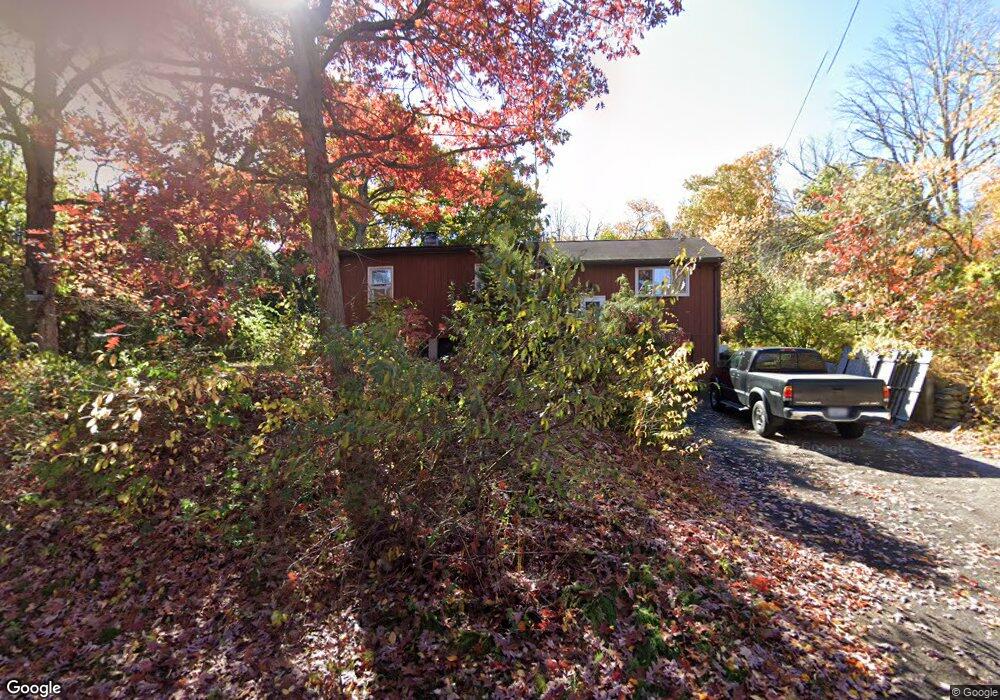
36 Riverside Ave Johnston, RI 02919
Graniteville NeighborhoodEstimated Value: $375,012 - $424,000
3
Beds
1
Bath
1,320
Sq Ft
$302/Sq Ft
Est. Value
About This Home
This home is located at 36 Riverside Ave, Johnston, RI 02919 and is currently estimated at $398,253, approximately $301 per square foot. 36 Riverside Ave is a home located in Providence County with nearby schools including Johnston Senior High School and St. Thomas Regional School.
Ownership History
Date
Name
Owned For
Owner Type
Purchase Details
Closed on
Sep 28, 2005
Sold by
Saviano Patricia C and Saviano John E
Bought by
Saviano John E
Current Estimated Value
Home Financials for this Owner
Home Financials are based on the most recent Mortgage that was taken out on this home.
Original Mortgage
$229,500
Outstanding Balance
$120,044
Interest Rate
5.79%
Estimated Equity
$278,209
Purchase Details
Closed on
May 12, 2000
Sold by
Dimeglio Edmund D and Dimeglio Mary L
Bought by
Vellucci Lisa J and Saviano John E
Create a Home Valuation Report for This Property
The Home Valuation Report is an in-depth analysis detailing your home's value as well as a comparison with similar homes in the area
Home Values in the Area
Average Home Value in this Area
Purchase History
| Date | Buyer | Sale Price | Title Company |
|---|---|---|---|
| Saviano John E | $10,000 | -- | |
| Vellucci Lisa J | $107,000 | -- | |
| Saviano John E | $10,000 | -- | |
| Vellucci Lisa J | $107,000 | -- |
Source: Public Records
Mortgage History
| Date | Status | Borrower | Loan Amount |
|---|---|---|---|
| Open | Vellucci Lisa J | $229,500 | |
| Closed | Vellucci Lisa J | $184,000 |
Source: Public Records
Tax History
| Year | Tax Paid | Tax Assessment Tax Assessment Total Assessment is a certain percentage of the fair market value that is determined by local assessors to be the total taxable value of land and additions on the property. | Land | Improvement |
|---|---|---|---|---|
| 2025 | $3,911 | $250,400 | $79,700 | $170,700 |
| 2024 | $3,831 | $250,400 | $79,700 | $170,700 |
| 2023 | $3,831 | $250,400 | $79,700 | $170,700 |
| 2022 | $2,477 | $156,100 | $56,600 | $99,500 |
| 2021 | $3,628 | $156,100 | $56,600 | $99,500 |
| 2018 | $3,491 | $127,000 | $48,700 | $78,300 |
| 2016 | $4,619 | $127,000 | $48,700 | $78,300 |
| 2015 | $3,319 | $114,500 | $44,300 | $70,200 |
| 2014 | $2,108 | $114,500 | $44,300 | $70,200 |
| 2013 | $3,292 | $114,500 | $44,300 | $70,200 |
Source: Public Records
Map
Nearby Homes
Your Personal Tour Guide
Ask me questions while you tour the home.