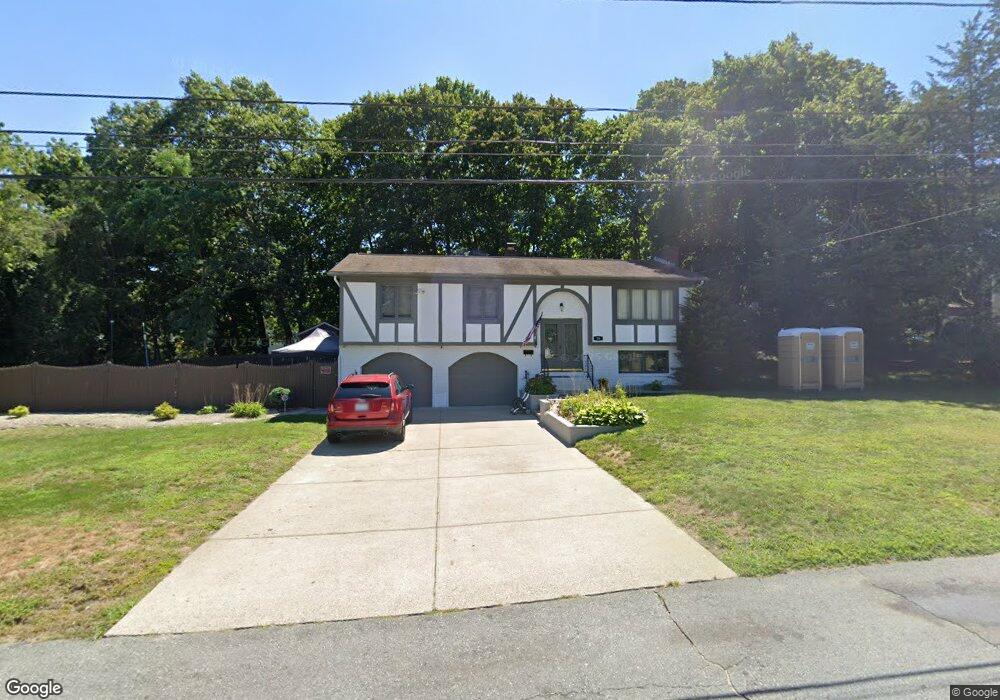
36 Shenandoah Rd Warwick, RI 02886
Cowesett NeighborhoodEstimated Value: $524,000 - $586,000
3
Beds
3
Baths
1,700
Sq Ft
$327/Sq Ft
Est. Value
About This Home
This home is located at 36 Shenandoah Rd, Warwick, RI 02886 and is currently estimated at $556,408, approximately $327 per square foot. 36 Shenandoah Rd is a home located in Kent County with nearby schools including Our Lady of Mercy School.
Ownership History
Date
Name
Owned For
Owner Type
Purchase Details
Closed on
Feb 3, 2025
Sold by
Michael T Dacey Irt and Mchugh
Bought by
Michael T Dacey T T and Michael Dacey
Current Estimated Value
Purchase Details
Closed on
Nov 17, 2022
Sold by
Michael T Dacey T T and Michael Dacey
Bought by
Michael T Dacey Irt and Dacey
Purchase Details
Closed on
May 12, 2016
Sold by
Dacey Michael T
Bought by
Dacey Michael T
Purchase Details
Closed on
Feb 11, 2004
Sold by
Greenberg Lynda R
Bought by
Dacey Michael T
Home Financials for this Owner
Home Financials are based on the most recent Mortgage that was taken out on this home.
Original Mortgage
$220,000
Interest Rate
5.82%
Mortgage Type
Purchase Money Mortgage
Create a Home Valuation Report for This Property
The Home Valuation Report is an in-depth analysis detailing your home's value as well as a comparison with similar homes in the area
Home Values in the Area
Average Home Value in this Area
Purchase History
| Date | Buyer | Sale Price | Title Company |
|---|---|---|---|
| Michael T Dacey T T | -- | None Available | |
| Michael T Dacey T T | -- | None Available | |
| Michael T Dacey Irt | -- | None Available | |
| Michael T Dacey Irt | -- | None Available | |
| Dacey Michael T | -- | -- | |
| Dacey Michael T | -- | -- | |
| Dacey Michael T | $275,000 | -- | |
| Dacey Michael T | $275,000 | -- |
Source: Public Records
Mortgage History
| Date | Status | Borrower | Loan Amount |
|---|---|---|---|
| Previous Owner | Dacey Michael T | $225,500 | |
| Previous Owner | Dacey Michael T | $220,000 |
Source: Public Records
Tax History
| Year | Tax Paid | Tax Assessment Tax Assessment Total Assessment is a certain percentage of the fair market value that is determined by local assessors to be the total taxable value of land and additions on the property. | Land | Improvement |
|---|---|---|---|---|
| 2025 | $6,200 | $488,200 | $162,200 | $326,000 |
| 2024 | $6,161 | $425,800 | $140,900 | $284,900 |
| 2023 | $6,042 | $425,800 | $140,900 | $284,900 |
| 2022 | $6,173 | $329,600 | $110,600 | $219,000 |
| 2021 | $6,173 | $329,600 | $110,600 | $219,000 |
| 2020 | $6,173 | $329,600 | $110,600 | $219,000 |
| 2019 | $6,173 | $329,600 | $110,600 | $219,000 |
| 2018 | $5,689 | $281,100 | $113,400 | $167,700 |
| 2017 | $5,689 | $281,100 | $113,400 | $167,700 |
| 2016 | $5,689 | $281,100 | $113,400 | $167,700 |
| 2015 | $4,739 | $228,400 | $92,600 | $135,800 |
| 2014 | $4,582 | $228,400 | $92,600 | $135,800 |
| 2013 | $4,520 | $228,400 | $92,600 | $135,800 |
Source: Public Records
Map
Nearby Homes
- 123 Cowesett Rd
- 3800 Post Rd Unit 4
- 170 Cowesett Rd
- 52 Bruce Ln
- 6 Island View Dr
- 43 Highland Ave
- 3940 Post Rd Unit 26
- 3940 Post Rd Unit 3
- 155 Birkshire Dr
- 3976 Post Rd
- 3399 Post Rd Unit 15
- 48 Patrick Way
- 151 Drum Rock Ave
- 52 Benefit St
- 146 Edmond Dr
- 10 Arrowhead Way
- 6 Contour Rd
- 84 Spruce St
- 3524 W Shore Rd Unit 215
- 110 Tiernan Ave
- 47 Ashmont St
- 44 Shenandoah Rd
- 22 Shenandoah Rd
- 35 Ashmont St
- 35 Shenandoah Rd
- 8 Hibiscus Ln
- 45 Shenandoah Rd
- 54 Shenandoah Rd
- 23 Shenandoah Rd
- 5 Taylor Ln
- 1 Taylor Ln
- 48 Ashmont St
- 11 Shenandoah Rd
- 17 Ashmont St
- 62 Shenandoah Rd
- 3 Hibiscus Ln
- 1 Hibiscus Ln
- 5 Hibiscus Ln
- 29 Ashmont St
- 12 Shenandoah Rd
Your Personal Tour Guide
Ask me questions while you tour the home.