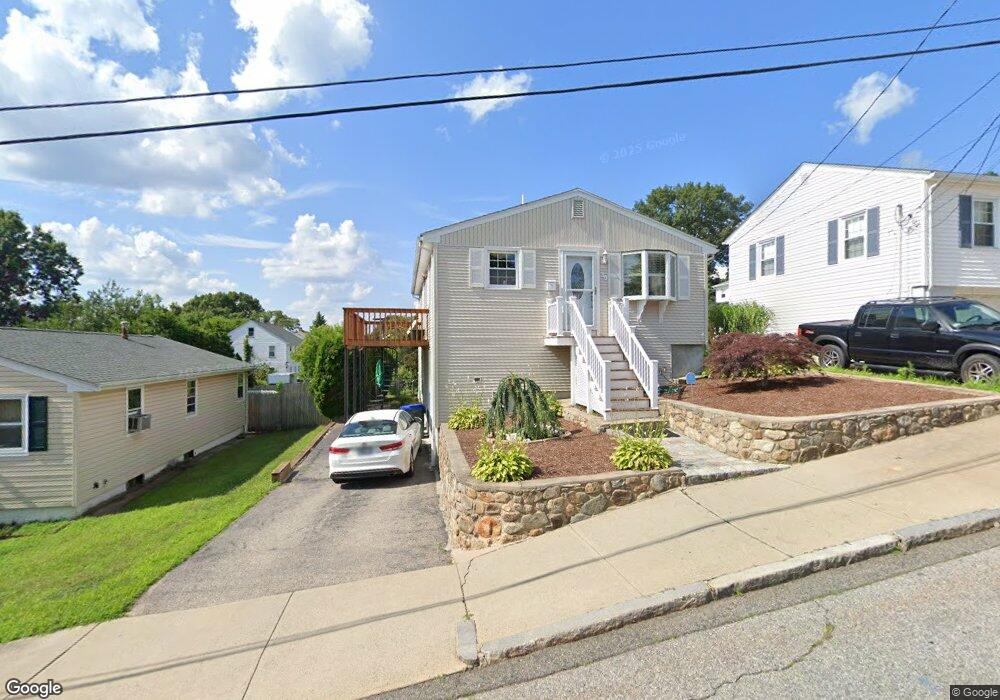
36 Smart St Providence, RI 02904
Charles NeighborhoodEstimated Value: $399,528 - $529,000
3
Beds
2
Baths
1,720
Sq Ft
$257/Sq Ft
Est. Value
About This Home
This home is located at 36 Smart St, Providence, RI 02904 and is currently estimated at $441,632, approximately $256 per square foot. 36 Smart St is a home located in Providence County with nearby schools including Times Squared Academy, Times2 Elementary School, and Times2 Middle/High School.
Ownership History
Date
Name
Owned For
Owner Type
Purchase Details
Closed on
Apr 28, 1994
Sold by
Parrish Charles A and Parrish Roxanne
Bought by
Salvatore Michael L and Salvatore Nascienza
Current Estimated Value
Home Financials for this Owner
Home Financials are based on the most recent Mortgage that was taken out on this home.
Original Mortgage
$55,000
Interest Rate
7.7%
Create a Home Valuation Report for This Property
The Home Valuation Report is an in-depth analysis detailing your home's value as well as a comparison with similar homes in the area
Home Values in the Area
Average Home Value in this Area
Purchase History
| Date | Buyer | Sale Price | Title Company |
|---|---|---|---|
| Salvatore Michael L | $90,000 | -- |
Source: Public Records
Mortgage History
| Date | Status | Borrower | Loan Amount |
|---|---|---|---|
| Open | Salvatore Michael L | $100,000 | |
| Closed | Salvatore Michael L | $25,240 | |
| Closed | Salvatore Michael L | $54,600 | |
| Closed | Salvatore Michael L | $55,000 |
Source: Public Records
Tax History
| Year | Tax Paid | Tax Assessment Tax Assessment Total Assessment is a certain percentage of the fair market value that is determined by local assessors to be the total taxable value of land and additions on the property. | Land | Improvement |
|---|---|---|---|---|
| 2025 | $3,401 | $404,900 | $126,800 | $278,100 |
| 2024 | $5,742 | $312,900 | $83,200 | $229,700 |
| 2023 | $5,742 | $312,900 | $83,200 | $229,700 |
| 2022 | $2,298 | $312,900 | $83,200 | $229,700 |
| 2021 | $2,298 | $190,600 | $60,400 | $130,200 |
| 2020 | $2,298 | $190,600 | $60,400 | $130,200 |
| 2019 | $4,681 | $190,600 | $60,400 | $130,200 |
| 2018 | $4,219 | $132,000 | $46,700 | $85,300 |
| 2017 | $4,219 | $132,000 | $46,700 | $85,300 |
| 2016 | $4,219 | $132,000 | $46,700 | $85,300 |
| 2015 | $4,171 | $126,000 | $47,200 | $78,800 |
| 2014 | $4,253 | $126,000 | $47,200 | $78,800 |
| 2013 | $4,253 | $126,000 | $47,200 | $78,800 |
Source: Public Records
Map
Nearby Homes
Your Personal Tour Guide
Ask me questions while you tour the home.