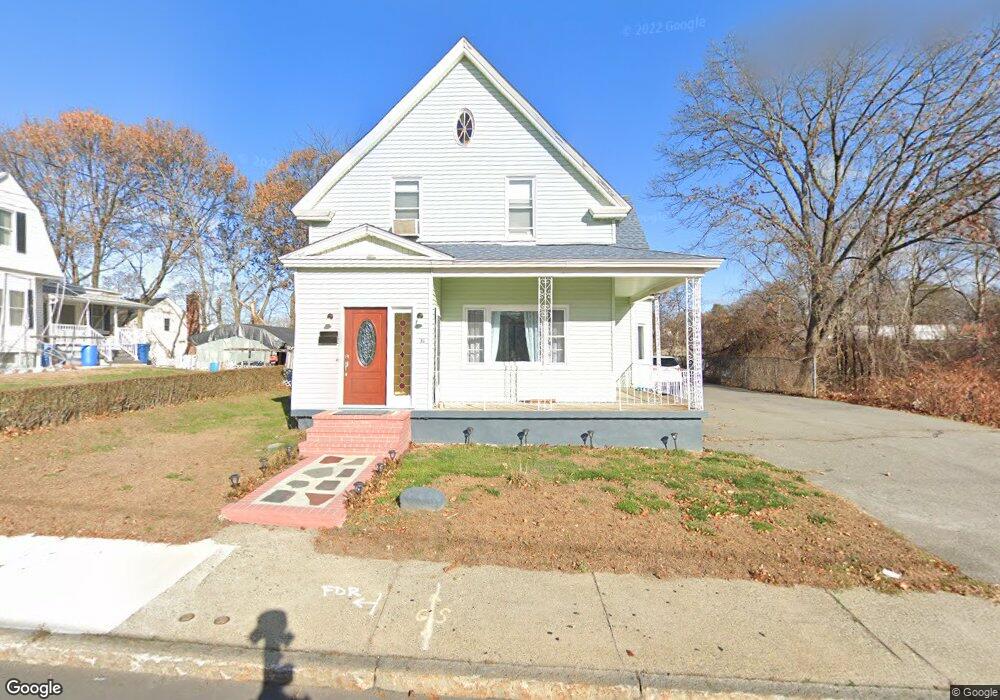
36 South St Lawrence, MA 01843
Mount Vernon NeighborhoodEstimated Value: $488,000 - $510,000
3
Beds
1
Bath
1,367
Sq Ft
$364/Sq Ft
Est. Value
About This Home
This home is located at 36 South St, Lawrence, MA 01843 and is currently estimated at $497,720, approximately $364 per square foot. 36 South St is a home located in Essex County with nearby schools including Olive Branch Elementary School, John Breen School, and School For Exceptional Studies.
Ownership History
Date
Name
Owned For
Owner Type
Purchase Details
Closed on
May 11, 2017
Sold by
Diaz Johelvi and Diaz Elpidio
Bought by
Diaz Johelvi and Diaz Elpidio
Current Estimated Value
Purchase Details
Closed on
Mar 12, 2008
Sold by
Us Bk
Bought by
Diaz Johelvi and Diaz Elpidio
Home Financials for this Owner
Home Financials are based on the most recent Mortgage that was taken out on this home.
Original Mortgage
$143,940
Interest Rate
5.72%
Mortgage Type
Purchase Money Mortgage
Purchase Details
Closed on
Oct 10, 2007
Sold by
Ventura Carmen
Bought by
Us Bk
Purchase Details
Closed on
Mar 28, 2006
Sold by
36 South St Rt and Frazzini Joseph
Bought by
Ventura Carmen and Ventura Jose
Home Financials for this Owner
Home Financials are based on the most recent Mortgage that was taken out on this home.
Original Mortgage
$224,000
Interest Rate
6.28%
Mortgage Type
Purchase Money Mortgage
Create a Home Valuation Report for This Property
The Home Valuation Report is an in-depth analysis detailing your home's value as well as a comparison with similar homes in the area
Home Values in the Area
Average Home Value in this Area
Purchase History
| Date | Buyer | Sale Price | Title Company |
|---|---|---|---|
| Diaz Johelvi | -- | -- | |
| Diaz Johelvi | $151,500 | -- | |
| Us Bk | $189,550 | -- | |
| Ventura Carmen | $280,000 | -- |
Source: Public Records
Mortgage History
| Date | Status | Borrower | Loan Amount |
|---|---|---|---|
| Previous Owner | Diaz Johelvi | $143,940 | |
| Previous Owner | Ventura Carmen | $224,000 |
Source: Public Records
Tax History Compared to Growth
Tax History
| Year | Tax Paid | Tax Assessment Tax Assessment Total Assessment is a certain percentage of the fair market value that is determined by local assessors to be the total taxable value of land and additions on the property. | Land | Improvement |
|---|---|---|---|---|
| 2025 | $3,443 | $391,200 | $118,000 | $273,200 |
| 2024 | $3,258 | $352,200 | $127,700 | $224,500 |
| 2023 | $3,355 | $330,200 | $118,500 | $211,700 |
| 2022 | $3,133 | $273,900 | $107,300 | $166,600 |
| 2021 | $3,049 | $248,500 | $107,300 | $141,200 |
| 2020 | $2,807 | $225,800 | $101,800 | $124,000 |
| 2019 | $2,896 | $211,700 | $84,600 | $127,100 |
| 2018 | $3,122 | $218,000 | $80,100 | $137,900 |
| 2017 | $3,030 | $197,500 | $75,700 | $121,800 |
| 2016 | $2,876 | $185,400 | $62,300 | $123,100 |
| 2015 | $2,803 | $185,400 | $62,300 | $123,100 |
Source: Public Records
Map
Nearby Homes
- 5 Lafayette Ave
- 437 N Main St Unit C
- 102 Weare St
- 34 Leeds Terrace
- 24 Inman St Unit 32
- 5 W Kenneth St
- 11 W Hawley St
- 33 Jefferson St
- 27-29 Dorchester St
- 42 Beresford St
- 356-360 S Union St
- 111 Cambridge St Unit D
- 49 Bowdoin St Unit 51
- 6 Windsor St
- 15 Beaconsfield St
- 354 N Main St Unit 204
- 5 Marc Ln
- 10 Martingale Ln Unit 10
- 91 Farnham St
- 19 Front St