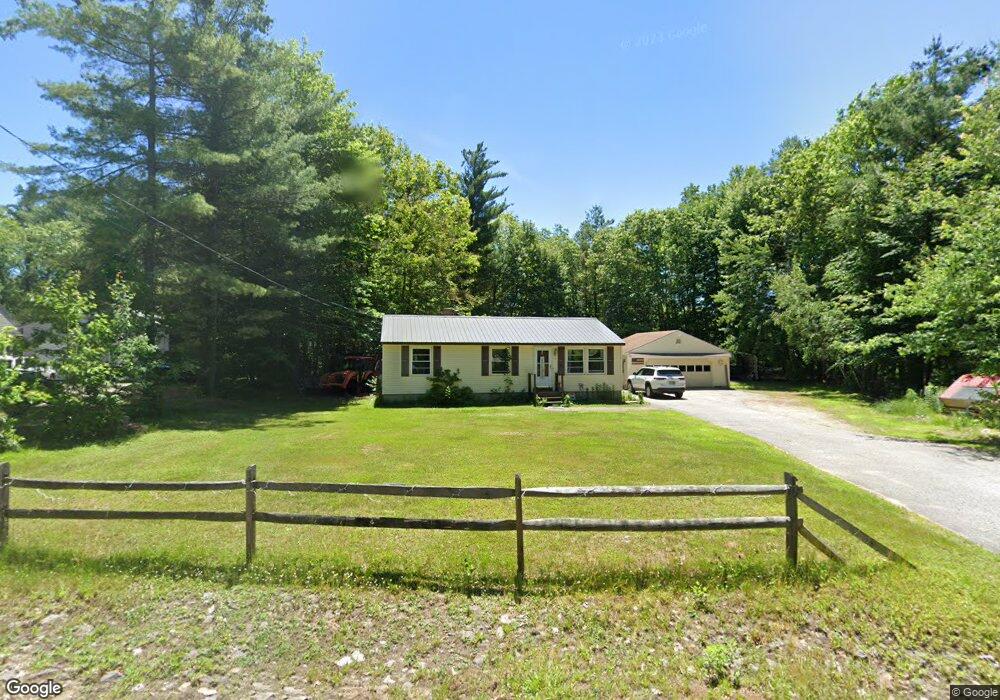
36 Tioga Dr Belmont, NH 03220
Estimated Value: $390,575 - $418,000
3
Beds
1
Bath
960
Sq Ft
$422/Sq Ft
Est. Value
About This Home
This home is located at 36 Tioga Dr, Belmont, NH 03220 and is currently estimated at $405,144, approximately $422 per square foot. 36 Tioga Dr is a home located in Belknap County with nearby schools including Belmont Elementary School, Belmont Middle School, and Belmont High School.
Ownership History
Date
Name
Owned For
Owner Type
Purchase Details
Closed on
Dec 4, 2007
Sold by
Harrison Katherine D and Harrison Michael L
Bought by
Decato Adam
Current Estimated Value
Home Financials for this Owner
Home Financials are based on the most recent Mortgage that was taken out on this home.
Original Mortgage
$165,667
Interest Rate
6.48%
Mortgage Type
Purchase Money Mortgage
Create a Home Valuation Report for This Property
The Home Valuation Report is an in-depth analysis detailing your home's value as well as a comparison with similar homes in the area
Home Values in the Area
Average Home Value in this Area
Purchase History
| Date | Buyer | Sale Price | Title Company |
|---|---|---|---|
| Decato Adam | $165,000 | -- |
Source: Public Records
Mortgage History
| Date | Status | Borrower | Loan Amount |
|---|---|---|---|
| Open | Decato Adam | $155,000 | |
| Closed | Decato Adam | $165,667 | |
| Previous Owner | Decato Adam | $20,000 |
Source: Public Records
Tax History Compared to Growth
Tax History
| Year | Tax Paid | Tax Assessment Tax Assessment Total Assessment is a certain percentage of the fair market value that is determined by local assessors to be the total taxable value of land and additions on the property. | Land | Improvement |
|---|---|---|---|---|
| 2024 | $5,382 | $341,900 | $80,300 | $261,600 |
| 2023 | $5,175 | $296,200 | $60,200 | $236,000 |
| 2022 | $5,087 | $266,200 | $51,900 | $214,300 |
| 2021 | $4,649 | $174,300 | $38,900 | $135,400 |
| 2020 | $4,417 | $174,300 | $38,900 | $135,400 |
| 2019 | $4,257 | $170,200 | $38,900 | $131,300 |
| 2017 | $4,119 | $141,500 | $40,400 | $101,100 |
| 2016 | $4,079 | $141,500 | $40,400 | $101,100 |
| 2015 | $4,000 | $141,500 | $40,400 | $101,100 |
| 2014 | $3,912 | $141,500 | $40,400 | $101,100 |
| 2013 | $3,963 | $176,600 | $70,000 | $106,600 |
Source: Public Records
Map
Nearby Homes