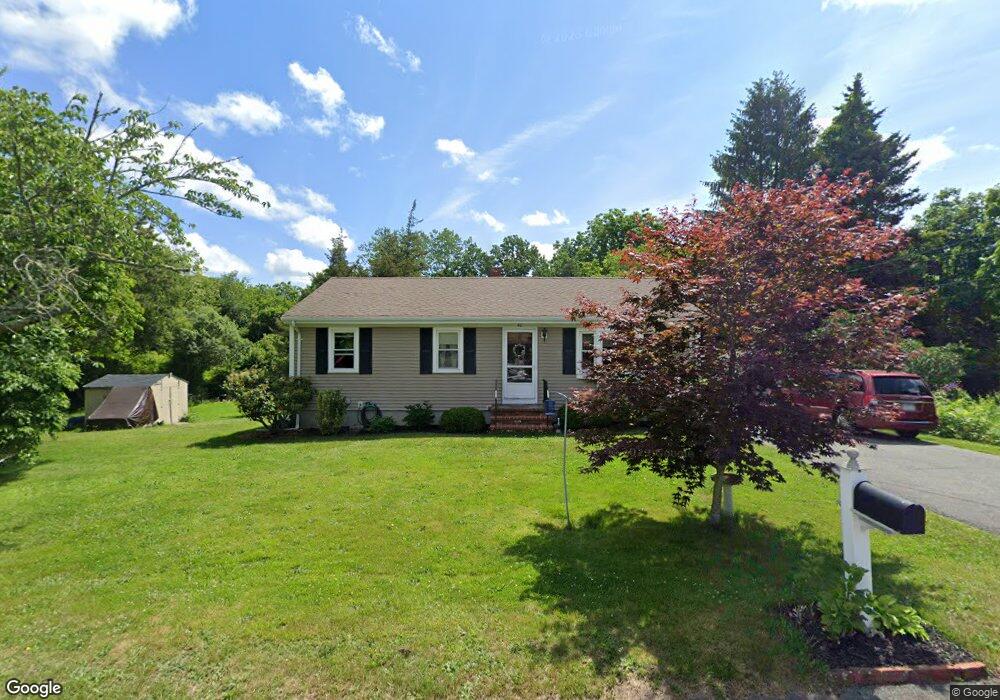
36 Union St Acushnet, MA 02743
North Fairhaven NeighborhoodEstimated Value: $418,000 - $534,000
3
Beds
1
Bath
1,000
Sq Ft
$473/Sq Ft
Est. Value
About This Home
This home is located at 36 Union St, Acushnet, MA 02743 and is currently estimated at $473,458, approximately $473 per square foot. 36 Union St is a home located in Bristol County with nearby schools including Acushnet Elementary School, Albert F Ford Middle School, and St Francis Xavier Elementary School.
Ownership History
Date
Name
Owned For
Owner Type
Purchase Details
Closed on
Dec 6, 2021
Sold by
Williams Craig C and Williams Joanna J
Bought by
Williams Joanna J
Current Estimated Value
Home Financials for this Owner
Home Financials are based on the most recent Mortgage that was taken out on this home.
Original Mortgage
$272,400
Outstanding Balance
$250,741
Interest Rate
3.14%
Mortgage Type
New Conventional
Estimated Equity
$222,717
Purchase Details
Closed on
Aug 25, 2008
Sold by
Est Jardin Genowafe M and Kamienski Donald R
Bought by
Williams Craig C and Williams Joanna J
Home Financials for this Owner
Home Financials are based on the most recent Mortgage that was taken out on this home.
Original Mortgage
$241,987
Interest Rate
6.4%
Mortgage Type
Purchase Money Mortgage
Create a Home Valuation Report for This Property
The Home Valuation Report is an in-depth analysis detailing your home's value as well as a comparison with similar homes in the area
Home Values in the Area
Average Home Value in this Area
Purchase History
We collect this data history from publicly available records. To have your information removed, we recommend requesting removal directly through your county’s website.
| Date | Buyer | Sale Price | Title Company |
|---|---|---|---|
| Williams Joanna J | -- | None Available | |
| Williams Joanna J | -- | None Available | |
| Williams Craig C | $249,000 | -- | |
| Williams Craig C | $249,000 | -- |
Source: Public Records
Mortgage History
We collect this data history from publicly available records. To have your information removed, we recommend requesting removal directly through your county’s website.
| Date | Status | Borrower | Loan Amount |
|---|---|---|---|
| Open | Williams Joanna J | $272,400 | |
| Closed | Williams Joanna J | $272,400 | |
| Previous Owner | Williams Craig C | $245,616 | |
| Previous Owner | Williams Craig C | $241,987 |
Source: Public Records
Tax History
| Year | Tax Paid | Tax Assessment Tax Assessment Total Assessment is a certain percentage of the fair market value that is determined by local assessors to be the total taxable value of land and additions on the property. | Land | Improvement |
|---|---|---|---|---|
| 2025 | $4,095 | $379,500 | $113,500 | $266,000 |
| 2024 | $3,881 | $340,100 | $108,200 | $231,900 |
| 2023 | $3,715 | $309,600 | $97,600 | $212,000 |
| 2022 | $3,702 | $279,000 | $92,400 | $186,600 |
| 2021 | $3,520 | $254,500 | $92,400 | $162,100 |
| 2020 | $3,548 | $254,500 | $92,400 | $162,100 |
| 2019 | $3,314 | $233,700 | $81,800 | $151,900 |
| 2018 | $3,198 | $221,800 | $81,800 | $140,000 |
| 2017 | $3,087 | $213,800 | $81,800 | $132,000 |
| 2016 | $3,000 | $206,500 | $81,800 | $124,700 |
| 2015 | $2,843 | $199,100 | $81,800 | $117,300 |
Source: Public Records
Map
Nearby Homes
- 20 Jake Ln
- 194 Riverside Ave
- 44 Bernard St
- 39 Veranda Ave
- 54 Slocum St
- 1934 Acushnet Ave
- 1930 Acushnet Ave
- 81 Sylvia St
- 15 Jean St
- 14 Hayes St Unit 1
- 104 Belleville Rd
- 105 Collette St
- 71 Sycamore St
- 82 Princeton St
- 11 Boylston St
- 123 Sawyer St Unit 1
- 4 Page St
- 2157 Acushnet Ave
- 34 Plympton St
- 148 Princeton St
Your Personal Tour Guide
Ask me questions while you tour the home.