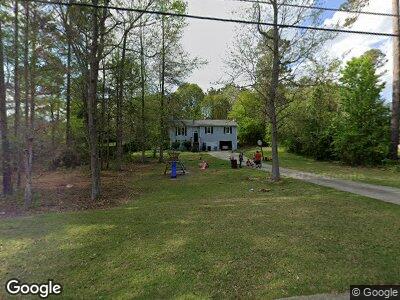
36 Valley Dr Hiram, GA 30141
Hiram NeighborhoodEstimated Value: $244,000 - $287,000
3
Beds
2
Baths
1,196
Sq Ft
$224/Sq Ft
Est. Value
About This Home
This home is located at 36 Valley Dr, Hiram, GA 30141 and is currently estimated at $268,116, approximately $224 per square foot. 36 Valley Dr is a home located in Paulding County with nearby schools including Sam D. Panter Elementary School, J. A. Dobbins Middle School, and Hiram High School.
Ownership History
Date
Name
Owned For
Owner Type
Purchase Details
Closed on
Sep 15, 2017
Sold by
Parker Mary
Bought by
Parker Timothy
Current Estimated Value
Home Financials for this Owner
Home Financials are based on the most recent Mortgage that was taken out on this home.
Original Mortgage
$119,352
Outstanding Balance
$105,231
Interest Rate
5.5%
Mortgage Type
FHA
Estimated Equity
$155,561
Purchase Details
Closed on
Jan 31, 2007
Sold by
Lanzo Patrick V
Bought by
Parker Timothy and Parker Mary
Home Financials for this Owner
Home Financials are based on the most recent Mortgage that was taken out on this home.
Original Mortgage
$121,201
Interest Rate
6.07%
Mortgage Type
FHA
Purchase Details
Closed on
Dec 2, 2005
Sold by
Lanzo Betty
Bought by
Lanzo Patrick
Purchase Details
Closed on
Sep 19, 1996
Sold by
Heath Richard A
Purchase Details
Closed on
Oct 9, 1995
Sold by
Heath Rebecca Ann
Purchase Details
Closed on
Jul 19, 1993
Sold by
Hobbs Wade A and Hobbs Judith R
Purchase Details
Closed on
Jul 8, 1991
Sold by
Arbor Square Inc
Purchase Details
Closed on
Feb 21, 1991
Create a Home Valuation Report for This Property
The Home Valuation Report is an in-depth analysis detailing your home's value as well as a comparison with similar homes in the area
Home Values in the Area
Average Home Value in this Area
Purchase History
| Date | Buyer | Sale Price | Title Company |
|---|---|---|---|
| Parker Timothy | -- | -- | |
| Parker Timothy | $122,200 | -- | |
| Lanzo Patrick | -- | -- |
Source: Public Records
Mortgage History
| Date | Status | Borrower | Loan Amount |
|---|---|---|---|
| Open | Parker Timothy | $6,401 | |
| Closed | Parker Timothy | $5,921 | |
| Open | Parker Timothy | $119,352 | |
| Previous Owner | Parker Timothy | $110,467 | |
| Previous Owner | Parker Timothy | $121,201 | |
| Previous Owner | Lanzo Betty I | $78,500 |
Source: Public Records
Tax History Compared to Growth
Tax History
| Year | Tax Paid | Tax Assessment Tax Assessment Total Assessment is a certain percentage of the fair market value that is determined by local assessors to be the total taxable value of land and additions on the property. | Land | Improvement |
|---|---|---|---|---|
| 2024 | $2,662 | $107,020 | $12,000 | $95,020 |
| 2023 | $2,671 | $102,448 | $12,000 | $90,448 |
| 2022 | $2,009 | $77,052 | $12,000 | $65,052 |
| 2021 | $1,827 | $62,864 | $8,000 | $54,864 |
| 2020 | $1,778 | $59,856 | $8,000 | $51,856 |
| 2019 | $1,517 | $50,352 | $8,000 | $42,352 |
| 2018 | $1,337 | $44,392 | $6,000 | $38,392 |
| 2017 | $1,450 | $47,460 | $6,000 | $41,460 |
| 2016 | $1,313 | $43,408 | $6,000 | $37,408 |
| 2015 | $1,074 | $34,896 | $6,000 | $28,896 |
| 2014 | $676 | $21,416 | $6,000 | $15,416 |
| 2013 | -- | $17,600 | $6,000 | $11,600 |
Source: Public Records
Map
Nearby Homes
- 36 Valley Dr
- 136 Cove Dr
- 136 Cove Dr
- 20 Valley Dr
- 0 Valley Dr Unit 7564881
- 0 Valley Dr Unit Drive 7539694
- 0 Valley Dr Unit 895 3205758
- 0 Valley Dr Unit 7020459
- 0 Valley Dr Unit 7360653
- 0 Valley Dr Unit Dr 7539694
- 0 Valley Dr
- 156 Cove Dr
- 156 Cove Dr
- 0 Gray Trail Unit 8383502
- 0 Cove Rd Unit 8667960
- 0 Cove Rd Unit 3242826
- 0 Cove Rd Unit 3260069
- 0 Cove Rd Unit 7312227
- 0 Cove Rd Unit 8284875
- 0 Cove Rd Unit 8237705