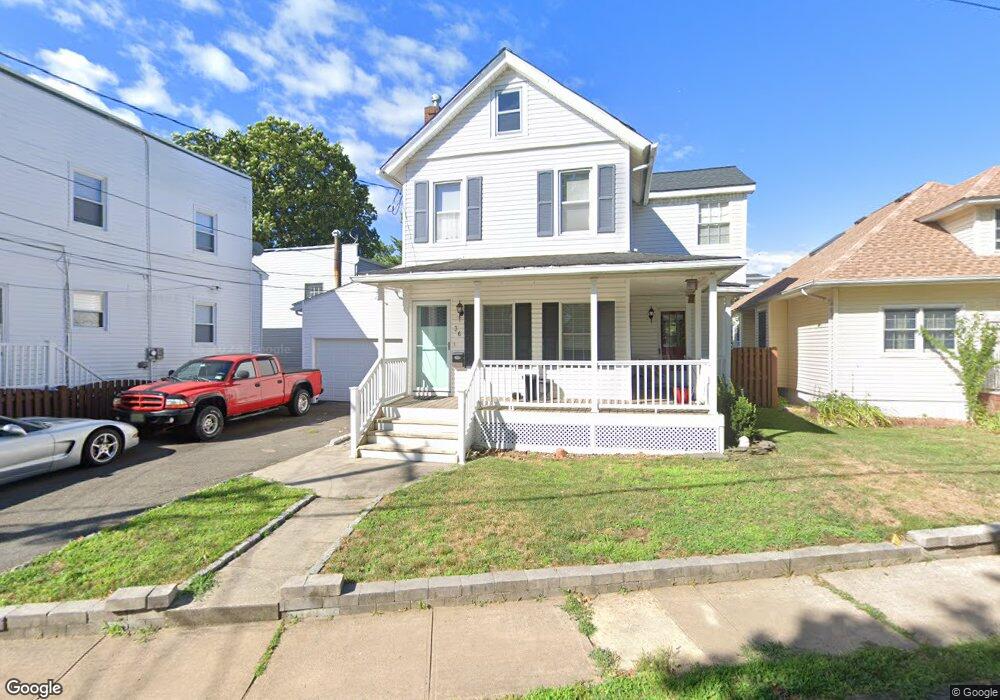
36 Walnut St Keyport, NJ 07735
Estimated Value: $422,000 - $496,000
3
Beds
1
Bath
1,264
Sq Ft
$362/Sq Ft
Est. Value
About This Home
This home is located at 36 Walnut St, Keyport, NJ 07735 and is currently estimated at $457,665, approximately $362 per square foot. 36 Walnut St is a home located in Monmouth County with nearby schools including Keyport Central School, Keyport High School, and Icob Academy.
Ownership History
Date
Name
Owned For
Owner Type
Purchase Details
Closed on
Jul 25, 2006
Sold by
Lovely James
Bought by
Jacobs Jeffery
Current Estimated Value
Home Financials for this Owner
Home Financials are based on the most recent Mortgage that was taken out on this home.
Original Mortgage
$188,000
Outstanding Balance
$112,533
Interest Rate
6.8%
Mortgage Type
New Conventional
Estimated Equity
$345,132
Purchase Details
Closed on
Jun 27, 2002
Sold by
Pruchnik Lynn
Bought by
Lovely James and Kwiatkowski Beverly
Home Financials for this Owner
Home Financials are based on the most recent Mortgage that was taken out on this home.
Original Mortgage
$108,000
Interest Rate
6.58%
Create a Home Valuation Report for This Property
The Home Valuation Report is an in-depth analysis detailing your home's value as well as a comparison with similar homes in the area
Home Values in the Area
Average Home Value in this Area
Purchase History
| Date | Buyer | Sale Price | Title Company |
|---|---|---|---|
| Jacobs Jeffery | $328,000 | -- | |
| Lovely James | $200,000 | -- |
Source: Public Records
Mortgage History
| Date | Status | Borrower | Loan Amount |
|---|---|---|---|
| Open | Jacobs Jeffery | $188,000 | |
| Previous Owner | Lovely James | $108,000 |
Source: Public Records
Tax History Compared to Growth
Tax History
| Year | Tax Paid | Tax Assessment Tax Assessment Total Assessment is a certain percentage of the fair market value that is determined by local assessors to be the total taxable value of land and additions on the property. | Land | Improvement |
|---|---|---|---|---|
| 2025 | $7,346 | $383,100 | $189,200 | $193,900 |
| 2024 | $7,247 | $354,900 | $151,800 | $203,100 |
Source: Public Records
Map
Nearby Homes
- 14 Cedar St
- 37 Myrtle Ave
- 162 2nd St
- 233 Broadway
- 74 Manchester Ave
- 72 Manchester Ave
- 87 Church St
- 55 E Front St
- 819 Saint John's Ave
- 226 Osborn St
- 2108 Florence Ave
- 1246 Florence Ave
- 17 Green Tree Cir
- 1242 Florence Ave
- 120 Victoria Place
- 1 Campbell St
- 4 Ellison Ct
- 231 Atlantic St Unit 23
- 231 Atlantic St Unit 83
- 8 Pine Creek Village