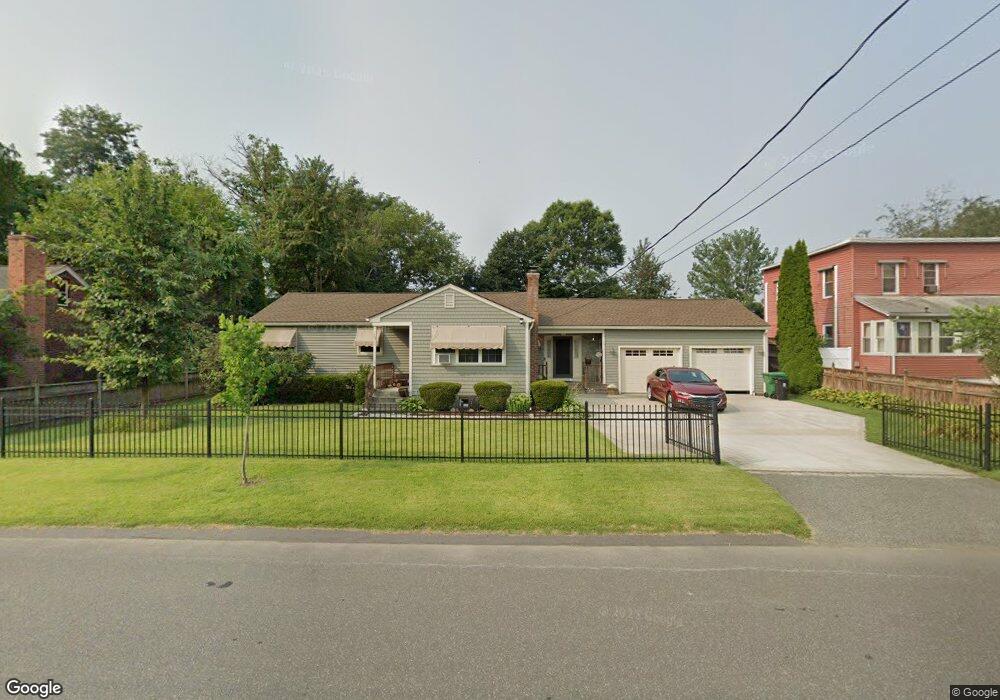
36 Warregan St Chicopee, MA 01013
Willimansett NeighborhoodEstimated Value: $287,000 - $314,120
3
Beds
1
Bath
1,100
Sq Ft
$273/Sq Ft
Est. Value
About This Home
This home is located at 36 Warregan St, Chicopee, MA 01013 and is currently estimated at $300,280, approximately $272 per square foot. 36 Warregan St is a home located in Hampden County with nearby schools including Fairview Elementary School, Bellamy Middle School, and Chicopee High School.
Ownership History
Date
Name
Owned For
Owner Type
Purchase Details
Closed on
Jun 14, 1996
Sold by
Syriac Kenneth W and Syriac Mary Ag
Bought by
Collins Scott A and Grasso Ann M
Current Estimated Value
Home Financials for this Owner
Home Financials are based on the most recent Mortgage that was taken out on this home.
Original Mortgage
$70,000
Outstanding Balance
$4,460
Interest Rate
7.97%
Mortgage Type
Purchase Money Mortgage
Estimated Equity
$295,820
Create a Home Valuation Report for This Property
The Home Valuation Report is an in-depth analysis detailing your home's value as well as a comparison with similar homes in the area
Home Values in the Area
Average Home Value in this Area
Purchase History
| Date | Buyer | Sale Price | Title Company |
|---|---|---|---|
| Collins Scott A | $92,000 | -- |
Source: Public Records
Mortgage History
| Date | Status | Borrower | Loan Amount |
|---|---|---|---|
| Open | Collins Scott A | $70,000 |
Source: Public Records
Tax History Compared to Growth
Tax History
| Year | Tax Paid | Tax Assessment Tax Assessment Total Assessment is a certain percentage of the fair market value that is determined by local assessors to be the total taxable value of land and additions on the property. | Land | Improvement |
|---|---|---|---|---|
| 2025 | $4,172 | $275,200 | $103,300 | $171,900 |
| 2024 | $3,956 | $268,000 | $101,200 | $166,800 |
| 2023 | $3,666 | $242,000 | $92,000 | $150,000 |
| 2022 | $3,491 | $205,500 | $80,000 | $125,500 |
| 2021 | $3,309 | $187,900 | $72,700 | $115,200 |
| 2020 | $3,146 | $180,200 | $72,700 | $107,500 |
| 2019 | $3,123 | $173,900 | $72,700 | $101,200 |
| 2018 | $3,049 | $166,500 | $69,200 | $97,300 |
| 2017 | $3,230 | $186,600 | $69,200 | $117,400 |
| 2016 | $2,936 | $173,600 | $69,200 | $104,400 |
| 2015 | $2,954 | $168,400 | $69,200 | $99,200 |
| 2014 | $1,477 | $168,400 | $69,200 | $99,200 |
Source: Public Records
Map
Nearby Homes
- 18 Charpentier Blvd
- 91 Norman St
- 551 Lafleur Dr
- 47 Dorrance St
- 39 State St
- 934 Main St
- 958 Main St
- 39 Daley St
- 26 Olivine St
- 12 Temple St
- 20 Mount Carmel Ave
- 176 Silvin Rd
- 5 Vernon St
- 861 Grattan St
- 133-135 Brown Ave
- 90 Mckinstry Ave Unit 117
- 4 Columbia St
- 210 Clarendon Ave
- 13 Willow St
- 219 Clarendon Ave