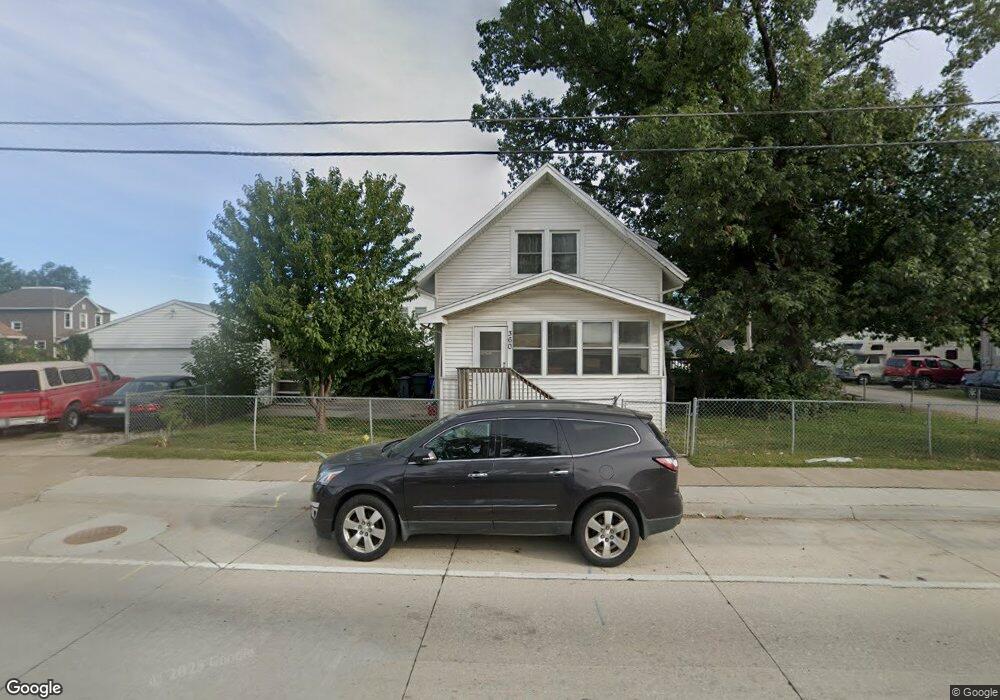
360 15th Ave SW Cedar Rapids, IA 52404
Taylor NeighborhoodEstimated Value: $126,000 - $157,346
2
Beds
1
Bath
1,020
Sq Ft
$133/Sq Ft
Est. Value
About This Home
This home is located at 360 15th Ave SW, Cedar Rapids, IA 52404 and is currently estimated at $135,337, approximately $132 per square foot. 360 15th Ave SW is a home located in Linn County with nearby schools including Cedar River Academy at Taylor Elementary School, Wilson Middle School, and Thomas Jefferson High School.
Ownership History
Date
Name
Owned For
Owner Type
Purchase Details
Closed on
May 28, 2002
Sold by
Hargens Scott A and Hargens Laura J
Bought by
Lattimer Robert D
Current Estimated Value
Home Financials for this Owner
Home Financials are based on the most recent Mortgage that was taken out on this home.
Original Mortgage
$77,140
Outstanding Balance
$33,054
Interest Rate
7%
Mortgage Type
FHA
Estimated Equity
$102,283
Create a Home Valuation Report for This Property
The Home Valuation Report is an in-depth analysis detailing your home's value as well as a comparison with similar homes in the area
Home Values in the Area
Average Home Value in this Area
Purchase History
| Date | Buyer | Sale Price | Title Company |
|---|---|---|---|
| Lattimer Robert D | $81,000 | -- |
Source: Public Records
Mortgage History
| Date | Status | Borrower | Loan Amount |
|---|---|---|---|
| Open | Lattimer Robert D | $77,140 |
Source: Public Records
Tax History
| Year | Tax Paid | Tax Assessment Tax Assessment Total Assessment is a certain percentage of the fair market value that is determined by local assessors to be the total taxable value of land and additions on the property. | Land | Improvement |
|---|---|---|---|---|
| 2025 | $1,826 | $128,500 | $29,500 | $99,000 |
| 2024 | $1,984 | $113,700 | $27,300 | $86,400 |
| 2023 | $1,984 | $113,700 | $27,300 | $86,400 |
| 2022 | $1,836 | $102,900 | $22,700 | $80,200 |
| 2021 | $1,712 | $97,600 | $23,000 | $74,600 |
| 2020 | $1,712 | $86,200 | $20,700 | $65,500 |
| 2019 | $1,622 | $83,800 | $20,700 | $63,100 |
Source: Public Records
Map
Nearby Homes