Estimated Value: $203,299 - $256,000
3
Beds
1
Bath
1,113
Sq Ft
$203/Sq Ft
Est. Value
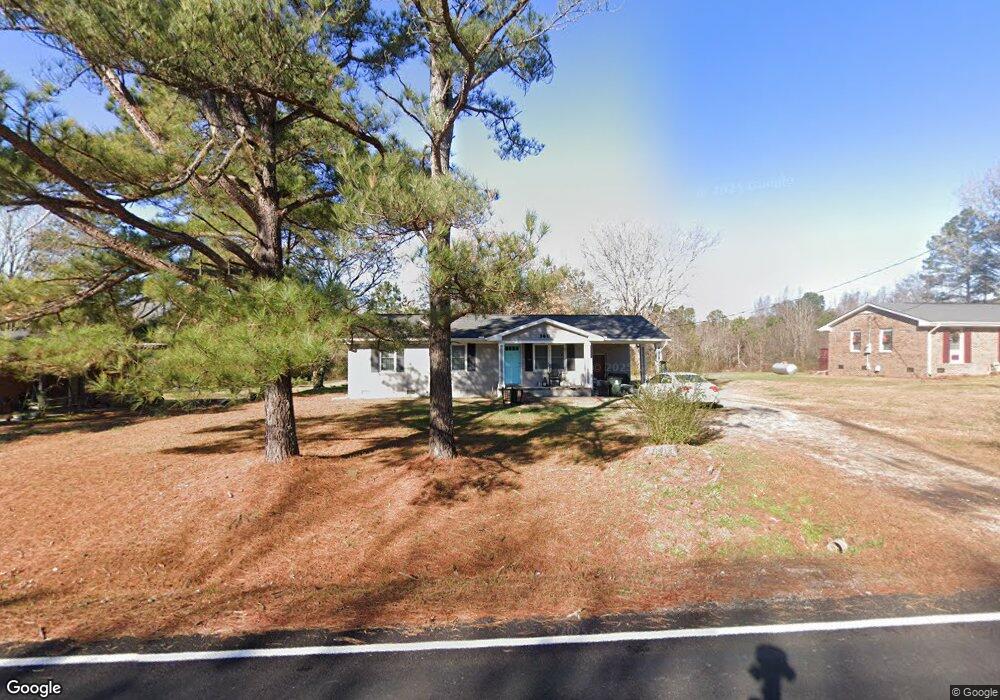
About This Home
This home is located at 360 Bunn Elementary School Rd, Bunn, NC 27508 and is currently estimated at $226,075, approximately $203 per square foot. 360 Bunn Elementary School Rd is a home located in Franklin County with nearby schools including Bunn Elementary School, Bunn Middle School, and Bunn High School.
Ownership History
Date
Name
Owned For
Owner Type
Purchase Details
Closed on
Aug 11, 2020
Sold by
Reddy Ian J and Reddy Heidi
Bought by
Kacirek Nathan and Kacirek Megan
Current Estimated Value
Home Financials for this Owner
Home Financials are based on the most recent Mortgage that was taken out on this home.
Original Mortgage
$164,900
Outstanding Balance
$145,618
Interest Rate
3%
Mortgage Type
New Conventional
Estimated Equity
$80,457
Purchase Details
Closed on
Jul 5, 2018
Sold by
Jj Home Repair & Remodel Llc
Bought by
Reddy Ian J
Home Financials for this Owner
Home Financials are based on the most recent Mortgage that was taken out on this home.
Original Mortgage
$135,858
Interest Rate
4.5%
Mortgage Type
New Conventional
Purchase Details
Closed on
Oct 18, 2017
Sold by
Brodie Clementine J and Lane Melissa J
Bought by
Jj Home Repair & Remodel Llc
Create a Home Valuation Report for This Property
The Home Valuation Report is an in-depth analysis detailing your home's value as well as a comparison with similar homes in the area
Home Values in the Area
Average Home Value in this Area
Purchase History
We collect this data history from publicly available records. To have your information removed, we recommend requesting removal directly through your county’s website.
| Date | Buyer | Sale Price | Title Company |
|---|---|---|---|
| Kacirek Nathan | $170,000 | None Available | |
| Reddy Ian J | $135,000 | None Available | |
| Jj Home Repair & Remodel Llc | $48,000 | Attorney |
Source: Public Records
Mortgage History
We collect this data history from publicly available records. To have your information removed, we recommend requesting removal directly through your county’s website.
| Date | Status | Borrower | Loan Amount |
|---|---|---|---|
| Open | Kacirek Nathan | $164,900 | |
| Previous Owner | Reddy Ian J | $135,858 |
Source: Public Records
Tax History
| Year | Tax Paid | Tax Assessment Tax Assessment Total Assessment is a certain percentage of the fair market value that is determined by local assessors to be the total taxable value of land and additions on the property. | Land | Improvement |
|---|---|---|---|---|
| 2025 | $1,178 | $187,316 | $22,126 | $165,190 |
| 2024 | $1,159 | $187,316 | $22,126 | $165,190 |
| 2023 | $910 | $93,010 | $15,910 | $77,100 |
| 2022 | $900 | $93,010 | $15,910 | $77,100 |
| 2021 | $909 | $93,010 | $15,910 | $77,100 |
| 2020 | $914 | $93,010 | $15,910 | $77,100 |
| 2019 | $896 | $93,010 | $15,910 | $77,100 |
| 2018 | $702 | $71,060 | $15,910 | $55,150 |
| 2017 | $667 | $61,340 | $15,910 | $45,430 |
| 2016 | $689 | $61,340 | $15,910 | $45,430 |
| 2015 | $689 | $61,340 | $15,910 | $45,430 |
| 2014 | $632 | $61,340 | $15,910 | $45,430 |
Source: Public Records
Map
Nearby Homes
- 494 Bunn Elementary School Rd
- 218 Warren Ave
- 686 N Carolina 98
- 65 Clemmons Ln
- 610 Brantleytown Rd
- 5 N Carolina 98
- 9 N Carolina 98
- 10 N Carolina 98
- 8 N Carolina 98
- 2 N Carolina 98
- 3 N Carolina 98
- 4 N Carolina 98
- 1 N Carolina 98
- 7 N Carolina 98
- 5776 Pearces Rd
- 952 Brantleytown Rd
- 0 Honeydo Ln
- 107 Claymont Rd
- 115 Water Willow Ln
- 45 Water Willow Ln
- 350 Bunn Elementary School Rd
- 370 Bunn Elementary School Rd
- 380 Bunn Elementary School Rd
- 355 Bunn Elementary School Rd
- 375 Bunn Elementary School Rd
- (TBD) Bunn Elememtary School Rd
- 385 Bunn Elementary School Rd
- 390 Bunn Elementary School Rd
- 395 Bunn Elementary School Rd
- 400 Bunn Elementary School Rd
- 400 Bunn Elememtary School Rd
- 330 Bunn Elementary School Rd
- 405 Bunn Elementary School Rd
- 410 Bunn Elementary School Rd
- 415 Bunn Elementary School Rd
- 415 Bunn Elememtary School Rd
- 315 Bunn Elementary School Rd
- 420 Bunn Elementary School Rd
- 425 Bunn Elementary School Rd
- 305 Bunn Elementary School Rd
Your Personal Tour Guide
Ask me questions while you tour the home.