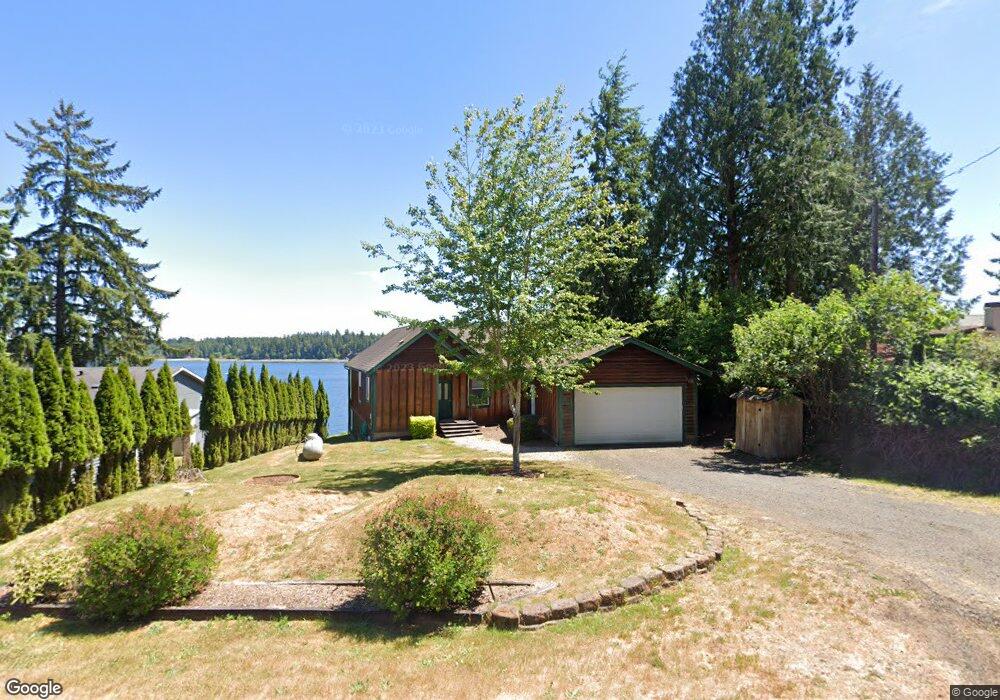
360 E Orchard Beach Dr Grapeview, WA 98546
Estimated Value: $744,000 - $995,000
3
Beds
2
Baths
1,700
Sq Ft
$502/Sq Ft
Est. Value
About This Home
This home is located at 360 E Orchard Beach Dr, Grapeview, WA 98546 and is currently estimated at $853,934, approximately $502 per square foot. 360 E Orchard Beach Dr is a home located in Mason County with nearby schools including Pioneer Primary School, Pioneer Intermediate/Middle School, and Abba's Garden Academy.
Ownership History
Date
Name
Owned For
Owner Type
Purchase Details
Closed on
Jul 15, 2009
Sold by
Stuart Nancy A
Bought by
Emtman Kyle and Emtman Michelle
Current Estimated Value
Home Financials for this Owner
Home Financials are based on the most recent Mortgage that was taken out on this home.
Original Mortgage
$392,000
Outstanding Balance
$259,460
Interest Rate
5.59%
Mortgage Type
New Conventional
Estimated Equity
$594,474
Purchase Details
Closed on
Jun 5, 2007
Sold by
Hotes C Martin and Hotes Carla J
Bought by
Stuart Nancy A
Home Financials for this Owner
Home Financials are based on the most recent Mortgage that was taken out on this home.
Original Mortgage
$75,001
Interest Rate
6.14%
Mortgage Type
Unknown
Create a Home Valuation Report for This Property
The Home Valuation Report is an in-depth analysis detailing your home's value as well as a comparison with similar homes in the area
Purchase History
| Date | Buyer | Sale Price | Title Company |
|---|---|---|---|
| Emtman Kyle | $490,000 | Land Title Company | |
| Stuart Nancy A | $540,000 | Mason County Title Ins Co |
Source: Public Records
Mortgage History
| Date | Status | Borrower | Loan Amount |
|---|---|---|---|
| Open | Emtman Kyle | $392,000 | |
| Previous Owner | Stuart Nancy A | $75,001 | |
| Previous Owner | Stuart Nancy A | $410,900 |
Source: Public Records
Tax History
| Year | Tax Paid | Tax Assessment Tax Assessment Total Assessment is a certain percentage of the fair market value that is determined by local assessors to be the total taxable value of land and additions on the property. | Land | Improvement |
|---|---|---|---|---|
| 2025 | $5,367 | $765,960 | $89,500 | $676,460 |
| 2024 | $5,367 | $703,985 | $85,480 | $618,505 |
| 2023 | $6,289 | $753,590 | $123,015 | $630,575 |
| 2022 | $6,488 | $662,870 | $119,440 | $543,430 |
| 2021 | $5,243 | $662,870 | $119,440 | $543,430 |
| 2020 | $5,165 | $521,080 | $135,620 | $385,460 |
| 2018 | $4,266 | $395,065 | $121,090 | $273,975 |
| 2017 | $3,595 | $395,285 | $121,310 | $273,975 |
| 2016 | $3,506 | $350,190 | $115,200 | $234,990 |
| 2015 | $3,287 | $341,820 | $111,600 | $230,220 |
| 2014 | -- | $348,900 | $114,000 | $234,900 |
| 2013 | -- | $323,740 | $108,000 | $215,740 |
Source: Public Records
Map
Nearby Homes
- 1236 E Island View Rd
- 81 E Panorama Way
- 4 E Cottonwood Dr
- 0 E Cottonwood Dr Unit 13 NWM2308746
- 0 E Cottonwood Dr Unit 40
- 0 E Cottonwood Dr Unit 40 NWM2308766
- 0 E Cottonwood Dr Unit 13 24324515
- 80 E Sea Breeze Ln
- 670 E Wilson Way
- 621 E Strong Rd
- 1130 E Sunset Hill Rd
- 930 E Wilson Way
- 900 930 E Wilson Way
- 900 E Wilson Way
- 320 Rivendell Rd
- 0 E Strong Rd Unit 34 24009692
- 0 E Strong Rd Unit 43 24316768
- 0 E Strong Rd Unit 34 NWM2308734
- 0 E Strong Rd Unit 43 NWM2308755
- 0 E Savage Ln
- 350 E Orchard Beach Dr
- 330 E Orchard Beach Dr
- 340 E Orchard Beach Dr
- 390 E Orchard Beach Dr
- 381 E Orchard Beach Dr
- 320 E Orchard Beach Dr
- 311 E Orchard Beach Dr
- 301 E Orchard Beach Dr
- 300 E Orchard Beach Dr
- 391 E Orchard Beach Dr
- 270 E Orchard Beach Dr
- 260 E Orchard Beach Dr
- 261 E Orchard Beach Dr
- 251 E Orchard Beach Dr
- 240 E Orchard Beach Dr
- 161 E Orchard Beach Rd
- 980 E Island View Rd
- 241 E Orchard Beach Dr
- 230 E Orchard Beach Dr
- 261 E Orchard Beach Rd
Your Personal Tour Guide
Ask me questions while you tour the home.