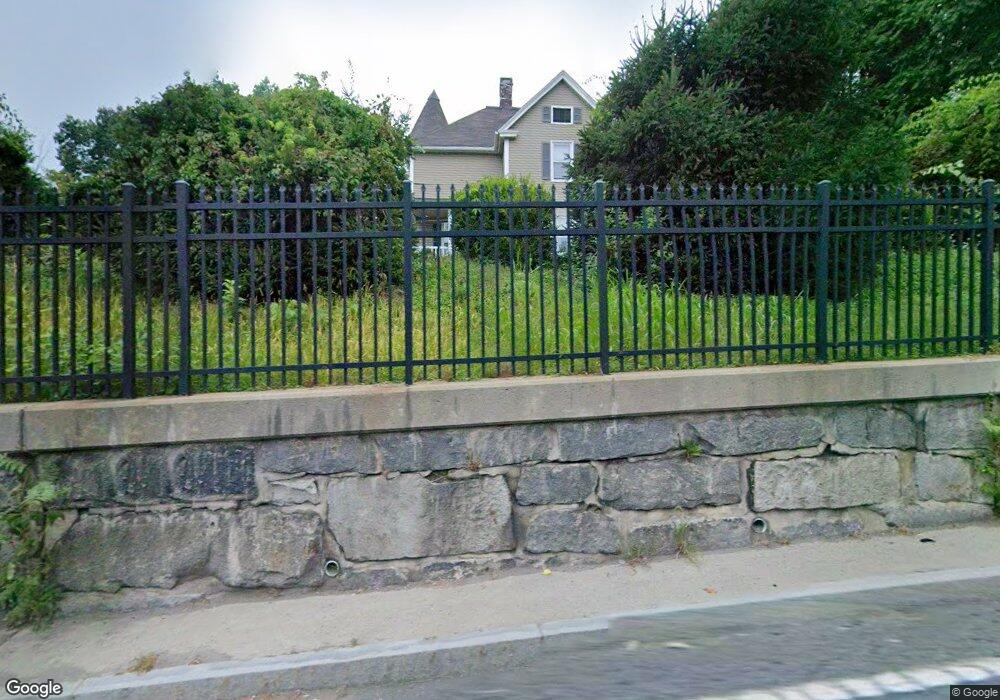
360 N Elm St Westfield, MA 01085
Estimated Value: $320,000 - $403,000
6
Beds
2
Baths
2,478
Sq Ft
$147/Sq Ft
Est. Value
About This Home
This home is located at 360 N Elm St, Westfield, MA 01085 and is currently estimated at $364,284, approximately $147 per square foot. 360 N Elm St is a home located in Hampden County with nearby schools including Westfield High School and Saint Mary High School.
Ownership History
Date
Name
Owned For
Owner Type
Purchase Details
Closed on
Apr 12, 1996
Sold by
Rodriquez Gilbert L and Rodriquez Jenaro
Bought by
Rodriguez Hector and Rodriquez Ruth M
Current Estimated Value
Home Financials for this Owner
Home Financials are based on the most recent Mortgage that was taken out on this home.
Original Mortgage
$60,000
Interest Rate
7.39%
Mortgage Type
Purchase Money Mortgage
Create a Home Valuation Report for This Property
The Home Valuation Report is an in-depth analysis detailing your home's value as well as a comparison with similar homes in the area
Home Values in the Area
Average Home Value in this Area
Purchase History
| Date | Buyer | Sale Price | Title Company |
|---|---|---|---|
| Rodriguez Hector | $75,000 | -- |
Source: Public Records
Mortgage History
| Date | Status | Borrower | Loan Amount |
|---|---|---|---|
| Open | Rodriguez Hector | $91,500 | |
| Closed | Rodriguez Hector | $30,000 | |
| Closed | Rodriguez Hector | $60,000 |
Source: Public Records
Tax History Compared to Growth
Tax History
| Year | Tax Paid | Tax Assessment Tax Assessment Total Assessment is a certain percentage of the fair market value that is determined by local assessors to be the total taxable value of land and additions on the property. | Land | Improvement |
|---|---|---|---|---|
| 2025 | $4,130 | $272,100 | $78,800 | $193,300 |
| 2024 | $4,087 | $255,900 | $71,600 | $184,300 |
| 2023 | $3,919 | $230,800 | $68,200 | $162,600 |
| 2022 | $3,864 | $209,000 | $60,800 | $148,200 |
| 2021 | $3,746 | $198,400 | $57,400 | $141,000 |
| 2020 | $3,611 | $187,600 | $57,400 | $130,200 |
| 2019 | $3,529 | $179,400 | $54,600 | $124,800 |
| 2018 | $1,827 | $161,300 | $54,600 | $106,700 |
| 2017 | $1,788 | $158,600 | $55,500 | $103,100 |
| 2016 | $3,083 | $158,600 | $55,500 | $103,100 |
| 2015 | $2,940 | $158,600 | $55,500 | $103,100 |
| 2014 | $2,196 | $158,600 | $55,500 | $103,100 |
Source: Public Records
Map
Nearby Homes
- 19 Arch Rd
- 99 Woodmont St
- 226 Notre Dame St
- 4 Columbia St
- 13 Furrow St
- 28 Union St
- 9 Montgomery St
- Lot 3 Montgomery
- 163 Barbara St
- 119 Union St Unit 4
- 118 Woodside Terrace
- 49 Pochassic St
- 125 Barbara St
- 315 Holyoke Rd
- 194 Lockhouse Rd
- 70 Yeoman Ave
- 12 Sibley Ave
- 0 Holyoke Rd
- 28 Orange St
- 13 William St
- 9 Lockhouse Rd
- 11 Lockhouse Rd
- 5 Lockhouse Rd
- 353 N Elm St
- 341 N Elm St
- 010 Lockhouse Rd
- 6 Lockhouse Rd
- 12 Lockhouse Rd
- 19 Lockhouse Rd
- 19 Lockhouse Rd
- 8 Lockhouse Rd
- 16 Lockhouse Rd
- 39 Hillside Ave
- 24 Lockhouse Rd
- 329R N Elm St
- 12 Hillside Ave
- 22 Buschmann Ave
- 15 Holyoke Rd
- 40 Hillside Ave
- 29 Buschmann Ave