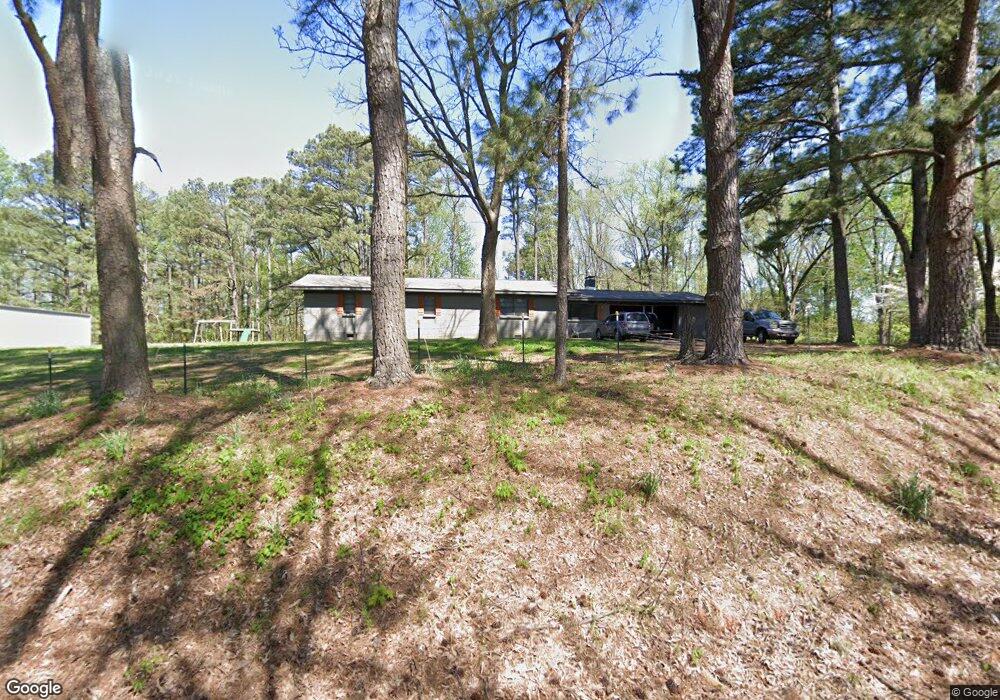
360 Watkins Rd Drummonds, TN 38023
Estimated Value: $270,000 - $309,628
Studio
2
Baths
1,963
Sq Ft
$148/Sq Ft
Est. Value
About This Home
This home is located at 360 Watkins Rd, Drummonds, TN 38023 and is currently estimated at $289,657, approximately $147 per square foot. 360 Watkins Rd is a home located in Tipton County with nearby schools including Drummonds Elementary School, Munford Middle School, and Munford High School.
Ownership History
Date
Name
Owned For
Owner Type
Purchase Details
Closed on
Aug 10, 2023
Sold by
Schelly Teresa A and Schelly Anthony J
Bought by
Baier George and Baier Heather
Current Estimated Value
Home Financials for this Owner
Home Financials are based on the most recent Mortgage that was taken out on this home.
Original Mortgage
$279,837
Outstanding Balance
$272,781
Interest Rate
6.71%
Mortgage Type
Construction
Estimated Equity
$16,876
Purchase Details
Closed on
Jun 5, 2022
Sold by
Christian Wade
Bought by
Schelly Anthony J and Schelly Teresa A
Home Financials for this Owner
Home Financials are based on the most recent Mortgage that was taken out on this home.
Original Mortgage
$204,000
Interest Rate
5.09%
Mortgage Type
Balloon
Purchase Details
Closed on
Jul 27, 2006
Bought by
Wade Christian and Wade Modeanna L
Purchase Details
Closed on
Mar 22, 1967
Bought by
Strickland Strickland J and Strickland Myrtle
Purchase Details
Closed on
Dec 16, 1960
Bought by
Strickland Strickland J and Strickland Myrtle
Create a Home Valuation Report for This Property
The Home Valuation Report is an in-depth analysis detailing your home's value as well as a comparison with similar homes in the area
Purchase History
| Date | Buyer | Sale Price | Title Company |
|---|---|---|---|
| Baier George | $58,000 | None Listed On Document | |
| Schelly Anthony J | -- | None Listed On Document | |
| Wade Christian | $93,000 | -- | |
| Strickland Strickland J | -- | -- | |
| Strickland Strickland J | -- | -- |
Source: Public Records
Mortgage History
| Date | Status | Borrower | Loan Amount |
|---|---|---|---|
| Open | Baier George | $279,837 | |
| Previous Owner | Schelly Anthony J | $204,000 |
Source: Public Records
Tax History
| Year | Tax Paid | Tax Assessment Tax Assessment Total Assessment is a certain percentage of the fair market value that is determined by local assessors to be the total taxable value of land and additions on the property. | Land | Improvement |
|---|---|---|---|---|
| 2025 | $1,167 | $76,675 | $25,900 | $50,775 |
| 2024 | $1,167 | $76,675 | $25,900 | $50,775 |
| 2023 | $1,167 | $76,675 | $25,900 | $50,775 |
| 2022 | $1,143 | $56,025 | $19,050 | $36,975 |
| 2021 | $1,143 | $56,025 | $19,050 | $36,975 |
| 2020 | $1,142 | $56,025 | $19,050 | $36,975 |
| 2019 | $904 | $37,375 | $17,325 | $20,050 |
| 2018 | $904 | $37,375 | $17,325 | $20,050 |
| 2017 | $904 | $37,375 | $17,325 | $20,050 |
| 2016 | $904 | $37,375 | $17,325 | $20,050 |
| 2015 | $903 | $37,375 | $17,325 | $20,050 |
| 2014 | $903 | $37,379 | $0 | $0 |
Source: Public Records
Map
Nearby Homes
- 218 Cedar Point Rd
- 0 Susan's Cir Unit 10212417
- 0 Barnett Bluff Rd
- 471 Milton Rd
- 37 N Wyatt Shankle Cove
- 544 Rachel Shankle Dr
- Cash Rd
- 5787 Richardson Landing Rd
- 138 Gayden Dr
- 1368 Mathis Rd
- 539 Meadowland Dr
- 410 Brown Rd
- 225 Poplar Grove Church Rd
- 1426 Simmons Rd
- 0 Campground Rd
- 0 Appleberry Rd
- 0 Dixon Rd
- 0 McClarin Dr
- 05 Richardson Landing Rd
- 8508 Campground Rd
- 363 Watkins Rd
- 314 Watkins Rd
- 265 Watkins Rd
- 470 Watkins Rd
- 512 Watkins Rd
- 198 Watkins Rd
- 505 Watkins Rd
- 63 Carl Miller Cove E
- 70 Carl Miller Cove E
- 2373 Tate Rd
- 553 Watkins Rd
- 50 Cedar Point Rd
- 49 Cedar Point Rd
- 170 Watkins Rd
- 493 Watkins Rd
- 64 Carl Miller Cove E
- 592 Watkins Rd
- 299 Watkins Rd
- 71 Cedar Point Rd
- 120 Watkins Rd
Your Personal Tour Guide
Ask me questions while you tour the home.